Nathan Barry, founder of Kit, sent out a newsletter today called "Obsess Over Your Bottlenecks": the summary of the Theory of Constraints he walked his own team through, resting on a series of posts by Tiago Forte that circulates as "the explanation" of the subject. The moral of the piece shows up twice, literally: "effort placed anywhere besides the bottleneck will make the bottleneck worse."
I went to check the series, the book, and the sentence. The series has 11 posts, not 3 — and the last three, the ones that say what to do after you find the bottleneck, sit behind a paywall of US$ 10 a month. Goldratt's famous five steps are not in the book everyone says they are in. And the moral sentence carries an error of degree that I did not want to argue by analogy: I wrote a queue simulator, published the code alongside this text, and measured.
The thesis that survives the measurement fits in one line: the constraint is a place, not an effort. Every bit of effort spent outside that place does not turn into output — it turns into queue. But "makes the bottleneck worse" is a half-truth, and the wrong half is exactly the one that gets people to speed up the wrong thing.
I will climb the ladder in four steps and one chapter. Stop wherever you like.
- The oven — the mechanism, without a single technical word.
- The names — the same drawing with the vocabulary that shows up in the books, and the central experiment: speeding up whoever is not the constraint.
- The math — Little's Law, and the five steps in full, read at the source.
- The bridge — what this says about AI agents, where the bottleneck moves around.
- The business chapter — Ford, Spanx, and Kit, each case checked before it went in.
First step: the oven
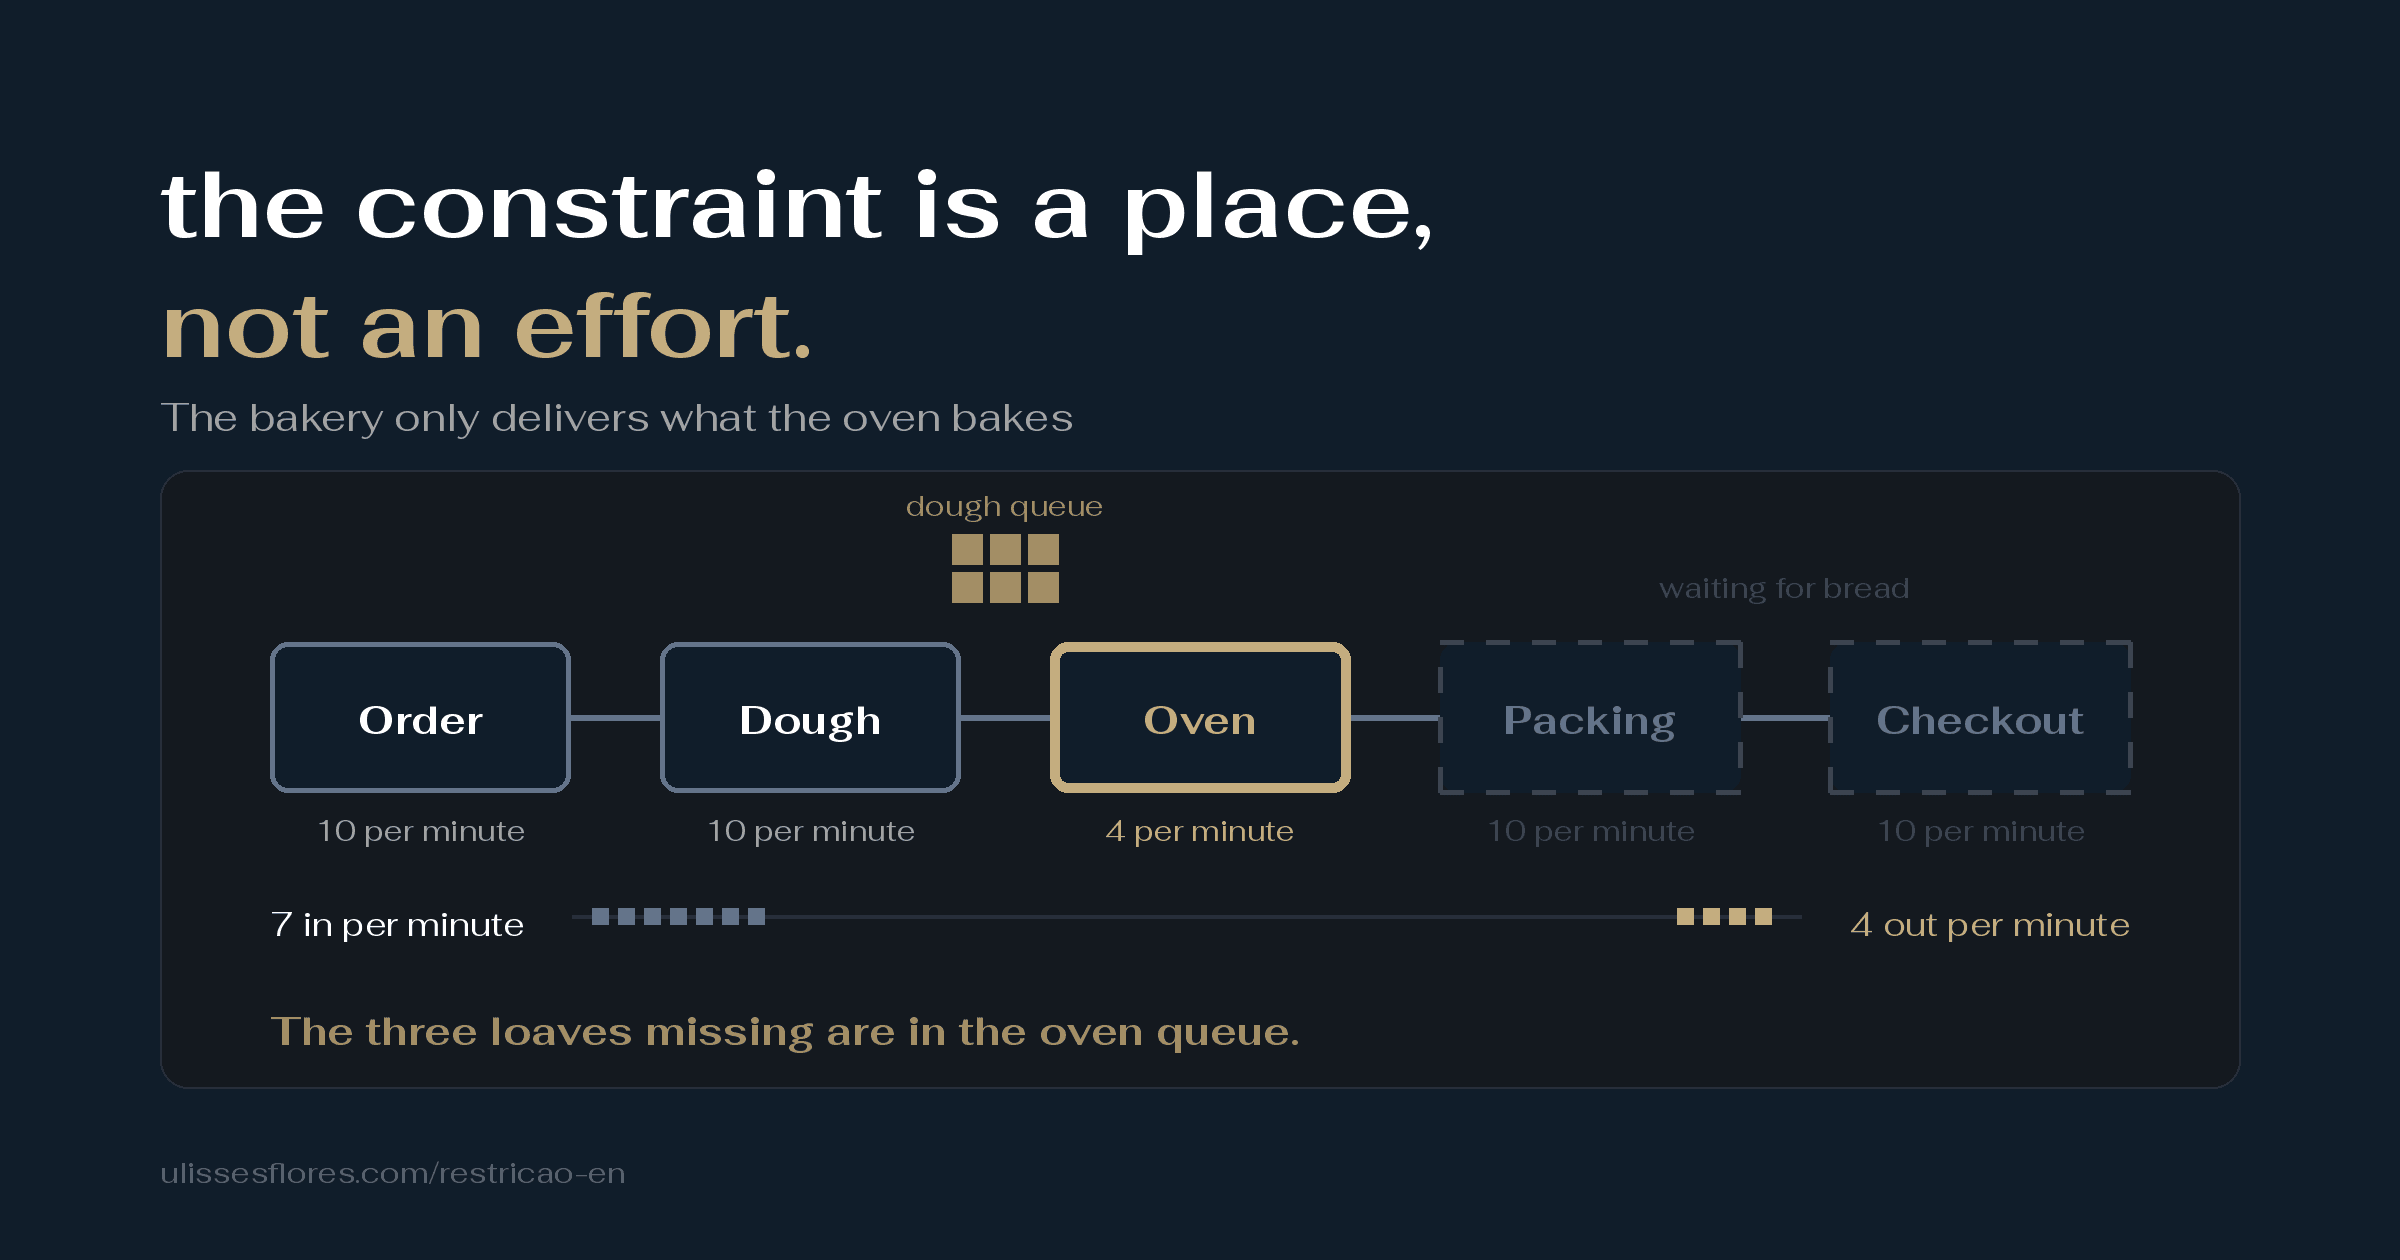
Picture a neighborhood bakery on a Sunday morning. The bread goes through five stations: someone takes the order, someone makes the dough, the oven bakes, someone packs, someone rings it up at the checkout. Four of those stations can handle ten loaves a minute. The oven handles four.
It does not matter what you do at the other four stations: the bakery delivers four loaves a minute. Hire the best order taker in town and he will produce exactly one thing — a bigger queue of dough waiting for the oven. Hire more people at the checkout and the checkout sits idle, waiting for bread that does not come out. The oven is the place. Everything that happens before it turns into queue; everything that happens after it turns into idleness.
Look at the gauge below the figure. Seven orders come in per minute and four loaves come out. The three that are missing did not vanish: they are in the queue in front of the oven, and the queue grows with every minute the morning goes on. That is the whole Theory of Constraints, with no technical name at all: the output of a system is the output of its slowest point, and whatever enters beyond that turns into waiting.
The newsletter uses another image, the freeway: eight lanes that narrow down to four because of construction. And it claims that, with a lot of cars, the narrowing produces "far more traffic, and less throughput, than if you only had four lanes from the beginning." The image is good and I went to check whether the claim is.
The phenomenon exists and has a name in traffic engineering: capacity drop, the fall in throughput that shows up when a queue forms at an active bottleneck. Except that the primary literature measures that drop at 5% to 10% — 5-6% at an Ontario bottleneck observed over twenty days (Hall and Agyemang-Duah, 1991), around 10% in Toronto (Cassidy and Bertini, 1999), and 7% is the default value the Highway Capacity Manual tells you to use. Nothing close to "far more traffic". And the mechanism the text alleges — "as everyone merges" — is not what was found: Banks (1991), studying exactly the bottlenecks where lanes merge, wrote that "merge conflicts were almost never the direct cause of flow breakdown." Nobody, as far as I found, has tested the exact comparison in that sentence — eight lanes becoming four against four from the beginning, under the same demand. The sentence is not false by measurement; it is a claim without an experiment.
What traffic engineering shows actually works is more interesting than the analogy. It is not narrowing the road upstream — it is regulating the rate of entry. When the Minnesota Department of Transportation shut off the ramp meters in Minneapolis-St. Paul for six weeks, in 2001, freeway capacity fell 9%, travel time rose 22% and crashes rose 26%. Hold on to that result: two steps from here my simulation will land on exactly the same conclusion, by another route.
Second step: the names, and the experiment that decides
Now the same drawing, with the words that show up in the books.
| In the bakery | In the books | What it measures |
|---|---|---|
| The oven | constraint or bottleneck | the station whose capacity limits the output of the system |
| Loaves out per minute | throughput | what the system delivers per unit of time |
| Dough waiting for the oven | work in process (WIP) | what has entered and has not left yet |
| From order to checkout | lead time | how long an item takes to cross |
| When to take the next order | release policy | the rule that decides when new work enters |
Goldratt separates bottleneck from constraint, and the distinction matters: a bottleneck is a resource with less capacity than demand asks for; a constraint is "anything that limits a system from achieving higher performance versus its goal" — including a rule. Every bottleneck is a constraint; not every constraint is a bottleneck. I come back to this on the third step, because it is the point where Goldratt himself says almost nobody looks.
The last row of the table is the one nobody draws and the one that decides everything. There are two common policies. Push: release new work whenever the first station is free — this is the "keep everyone busy" reflex, the instinct of every manager. The rope: release new work only when an item leaves the system — this is Goldratt's drum-buffer-rope, in its simplest form (constant work in process, CONWIP). The rope forces the first station to stand still on purpose. It is the one thing the Theory of Constraints asks for that no boss wants to hear.
How I measured
I wrote a simulator of a serial line: five stations, one server per station, random service time with a fixed mean, capacities of 10, 10, 4, 10 and 10 items per unit of time — the third station is the constraint, like the oven. Each run processes 400,000 items with a fixed seed; the code is pure Python, with no dependencies, and it is published alongside this article. The simulator was checked against the closed-form formula from queueing theory before it produced a single number: 4 tests, 4 passed, 0.03% error in the long case.
Methodological note. The model is deliberately simple: exponential service, the constraint fixed at the same station, no rework, no machine breakdown, no batching. It does not describe your factory or your team; it describes the mechanism that every factory and every team inherit. Every number in this article came out of the results file the script writes, not out of mental arithmetic — and the section "Where the theory does not work" says where the model stops holding.
Notice that the throughput line bends and goes flat exactly at 4 — the capacity of the oven. Doubling demand from 3.5 to 7.0 items per unit of time makes output rise from 3.50 to 4.00 (14%, the ceiling) and the work in process rise from 13 to 121,646 items — nine thousand times. It is the eight-lane freeway in numbers: what enters beyond the constraint does not leave; it waits.
The experiment that decides: speeding up whoever is not the constraint
Now the newsletter's question, measured. Under the push policy, I doubled the capacity of the first station (from 10 to 20). Then, instead of that, I elevated the constraint by 25% (from 4 to 5).
| Scenario (policy: push) | Throughput | Throughput gain | Rate of waiting growth |
|---|---|---|---|
| Baseline 10 · 10 · 4 · 10 · 10 | 4.018 | — | 0.150 |
| Double station 1 (10 -> 20) | 4.005 | -0.3% | 0.200 (+33%) |
| Elevate the constraint (4 -> 5, +25%) | 5.018 | +24.9% | 0.100 (-33%) |
Before the numbers, the bakery again — the same figure from the first step, now with the data from each scenario.
Notice that the gauge below did not change its output: twenty in, four out — the same four as before. What changed was the pile. The order taker twice as fast dumps dough in front of the oven twice as fast, and the queue grows 33% faster.
Notice that the gauge changed this time: five out. An oven 25% bigger delivered 24.9% more bread, and the pile shrank — the queue started growing 33% slower. It is the same effort as in the previous figure, placed in the only spot where it turns into bread. The bars below put the two scenarios side by side, in numbers.
Notice that the first two throughput bars are practically identical. Doubling the capacity of whoever is not the constraint did not deliver a single extra item — the -0.3% is noise — and it made the waiting grow 33% faster. Raising the constraint by 25% raised output by 24.9%: practically a one-for-one return, in the right place. It is the thesis in the title, in two bars: the constraint is a place, and effort only turns into output when it lands on it.
But note what the right-hand column says and the newsletter's sentence does not: the faster station 1 did not make the output worse — it made the waiting worse. Under the push policy the system never stabilizes; the queue grows with every item, and a first station twice as fast dumps dough into the queue twice as fast. The bottleneck itself did not get worse. What got worse was the time the customer waits and the amount of stuff standing still. Those are three different measures — throughput, waiting, work in process — and the catchphrase fuses all three.
The price of the rope
Same line, same capacities, only the release policy changes: a new item enters only when another one leaves, with at most six in process.
| Policy | Throughput | Lead time | Work in process |
|---|---|---|---|
| Push | 4.018 | 13,502 | 134,787 |
| Rope (six in process) | 3.813 | 1.52 | 5.8 |
Notice what went dashed: the stations before the oven wait too, on purpose. The bakery takes a new order only when a loaf leaves, and the pile never grows past a handful. The price is in the gauge — 3.8 out instead of 4 — and the gain is in the table above: the waiting practically disappears. The bars below put the two on a scale.
Notice the scale: it is logarithmic, because it would not fit any other way. The rope costs 5% of throughput — that is the honest price of deliberate idleness at the stations that are not the constraint — and it buys a lead time 8,900 times smaller and a work in process 23,000 times smaller. This is the paragraph that separates the Theory of Constraints from a motivational poster: it does not promise more output; it promises the same output with almost no waiting, and it charges for that a little idle labor. Goldratt called accepting this perhaps the biggest paradigm shift management has to make — for a single station to be 100% busy, all the others need spare capacity.
And this is where traffic engineering comes back. The Minneapolis ramp meters are a rope: they regulate entry instead of widening the road. Turning them off cost 9% of capacity and 22% of travel time, measured in the field over six weeks. My simulation, in a domain that has nothing to do with asphalt, says the same thing: what solves it is not speeding up whatever comes before the constraint, it is controlling how much gets in. Two independent domains, one measured by me and one measured by other people, pointing at the same lever.
One nuance, so that I do not trade one crude sentence for another. Under the rope, doubling station 1 gives +1.6% of throughput (from 3.813 to 3.874) — because a faster first station lowers the chance of the constraint running out of work. Improving outside the constraint is not nothing; it is almost nothing. The correct sentence is not "it has no effect", it is "it has almost no effect, and under the push policy it makes the waiting worse". The newsletter is right about the sign and wrong about the degree; and the mechanism it does not name — the release policy — is what decides whether the error is expensive.
Third step: the math, and the five steps in full
Little's Law
There is a formula that ties together the three measures from the previous step, and it is the most useful thing a manager can know about queues. John Little proved in 1961 that, in a stable system, the average number of items inside it equals the arrival rate times the average time each item spends in there:
L = λ · W
Work in process equals throughput times lead time. If the bakery bakes four loaves a minute and each order takes ten minutes from the counter to the checkout, there are forty orders in process at any instant — no matter how the bakery is organized inside. The formula has three conditions, and Little wrote them in the abstract of the paper: the three averages have to be finite and the process stationary. In bakery language: it holds as long as the queue is not exploding.
That gives you an instrument. If you measure the work in process one way and the product of
throughput times lead time another way, the two have to agree. When they stop agreeing, the
system has left the stable regime — demand has gone past the constraint. I measured that
residual, |L - λ·W| / L, with the constraint loaded from 55% to 110%.
Notice the line hugging zero up to load 1.00 and the jump right after it. In the stable regime the two paths agree to the fourth decimal place, and the measured lead time matches the closed-form formula from queueing theory within 1.7%. Above the constraint the residual opens up: 0.047 at 5% overload, 0.092 at 10%. The instrument works.
Now the limit, which is what separates whoever understood from whoever memorized. Exactly at 1.00 the residual does not fire — it reads 0.0001 — even though the lead time is already at 199.7, thirty-five times the value at point 0.95. At the critical point the queue grows too slowly for the residual to see it; it only flags sustained accumulation. In other words: the Little residual detects overload, not criticality. Anyone selling it as a universal queue alarm is selling more than the formula delivers, and I am not going to sell it.
The five steps, read at the source
The newsletter credits the Theory of Constraints to The Goal, "a 1984 business novel" by an "Israeli physicist". That checks out — with two corrections worth a paragraph. The first edition, from 1984, is called The Goal: Excellence in Manufacturing; the subtitle everybody quotes, A Process of Ongoing Improvement, only shows up in the 1986 revision. And the five focusing steps are not in that book. The novel introduces the idea of a constraint through the narrative; the formal list — identify, exploit, subordinate, elevate, go back — was verbalized by Goldratt in What Is This Thing Called the Theory of Constraints and How Should It Be Implemented?, from 1990. Almost every summary in circulation, Forte's series included, credits the list to the wrong book.
I read the official text of the five steps published by Goldratt's publisher, North River Press, signed by him and adapted from the 1990 book. The wording is this:
- Identify the system's constraints.
- Decide how to exploit the system's constraints.
- Subordinate everything else to the above decision.
- Elevate the system's constraints.
- If in the previous steps a constraint has been broken, go back to step one — but do not allow inertia to cause a system constraint.
Notice two details in the drawing. The first is the word in step 2: Goldratt wrote exploit — get the most out of what already exists at the constraint before spending money on it. Forte's series writes optimize in every post; the word exploit does not appear a single time in the corpus. It looks like pedantry and it is not: "optimize" invites you to buy capacity; "exploit" tells you first to stop wasting the capacity you already have.
The second detail is step 5, which is almost always summarized as "repeat". The official text does not say that. It says go back to step one and attaches a warning Goldratt calls impossible to overemphasize: when a constraint is broken, the rules the organization built because of it stay standing — and they become the next constraint. "We very rarely find a company with a real market constraint," he writes, "but rather, we find devastating marketing policy constraints." Rarely a bottleneck on the shop floor; almost always a production policy. Rarely a vendor; almost always a purchasing rule. It is the point where "bottleneck" and "constraint" part ways for good, and it is the half of the theory that the circulating version loses.
Steps 3, 4 and 5 are exactly the ones the simulation measures. Subordinate is the rope: the first station stops on purpose so that the constraint never runs out of work and the queue never fattens. Elevate is the second experiment: 25% more oven, 24.9% more output. Go back is what happens next: with the oven at 5, it is still the constraint — but if one day it reaches 10, the whole line is tied, and the constraint becomes whoever has the worst day. I did not simulate that scenario and I am not going to describe it as if I had.
Where the theory does not work
Beyond the mechanism, the Theory of Constraints sells an ontology: there is one place, it is identifiable, and the whole system should organize itself around it. I went after the strongest counterargument and it exists, with a name and a journal. Trietsch (2005) argues that drum-buffer-rope is inferior to methods that balance several criticalities at once, instead of a single drum. Linhares (2009) showed that Goldratt's rule for choosing a product mix is not optimal in general — if it were, it would imply P = NP. Gupta and Snyder (2009), in a literature review, conclude that TOC has still not demonstrated in the academic literature a link between implementation and financial results. Nave (2002) points out that it does not treat people or failed policies as a constraint — which is ironic, given the warning in step 5.
I declare what I read and what I did not: the full texts of Trietsch, Linhares, Gupta and Snyder and Nave were not read by me; the positions above come from the critical section that cites them, with the references checked. I report this as cited criticism, not as a reading of the primary sources.
And there is the criticism that is in no journal at all and that my simulation confirms inside out: the model keeps the constraint fixed at the same station. In a real system it moves. In knowledge work, in small teams, anywhere with high variability, today's constraint is tomorrow's noise — and a wandering constraint is indistinguishable from no constraint at all.
The synthesis that survives is this one, and it is the thesis of this article formulated by the opposition: Goldratt's negative — do not speed things up outside the constraint — survives the attack; the positive — there is a single stable place — does not. It is exactly what the bars in the second step showed: what can be measured safely is the cost of getting the place wrong, not the promise that the place stays put.
One collateral data point, measured. The Theory of Constraints died as a named school in engineering discussions: the lingua franca today is Kanban, WIP limits and Little's Law, and Goldratt is the cousin nobody cites in the pull request (the request to review code). Forte's series, in the places where reception can be measured, went by unnoticed — on Hacker News (the technology forum), the posts that were submitted landed between 2 and 4 points, with zero or one comment each. I did not measure Reddit, which blocks automated reading, and I am not going to claim anything about it. Added to the paywall, this explains why this article exists: the public half of the series teaches you to find the bottleneck; the half that says what to do next is closed, and the theory that holds it up is in a book almost nobody opens.
Fourth step: the bridge to AI agents
An AI agent in production is a line of stations. The request goes through model inference, through tool calls, through a database, sometimes through a sandbox (an isolated environment for running code) and a network, and in many cases through a human who reviews it. Each station has a capacity. One of them is the oven.
The instinct in the field is to assume that the oven is the model — and to optimize tokens (the chunks of text the model produces) per second. A characterization study published ten days ago on arXiv (the open repository of scientific papers) — From LLM Inference to Agentic Workloads, August 15, 2026 — measured ten agentic applications and found the opposite: components that are not the model dominate latency in 5 of the 10, and the bottleneck "shifts across requests, models, and deployments." The authors' conclusion is Goldratt's step 5, without citing Goldratt: optimizing tokens per second is no longer enough.
Notice that it is the same drawing as the first step, with the stations renamed. I left the constraint at the human review because that is where it tends to show up once inference got fast; but the point of the figure is that the position of the highlight is a measurement, not a conviction. Swapping models is speeding up station 1 at the bakery: if the queue is at the review, the new model only delivers drafts faster to the same tired person.
I had already measured this asymmetry in a problem that looks like a different one. In fraud detection, the literature has argued for twenty years about which architecture detects better. In a paper I published this month, I compared four model families under an auditable protocol and changed one single thing in each: the decision threshold — the number above which a transaction becomes an alert. Moving the neural network's threshold from the default 0.5 to the validation optimum took the test F1 from 0.267 to 0.812; swapping the architecture moved -0.007, with a confidence interval that crosses zero. A single scalar was worth two orders of magnitude more than the choice of model. In this article's language: the threshold was the constraint; the architecture was effort outside it — expensive, slow and with no effect on output.
Two works of mine still in preparation, with no link and no DOI — I cite them by result and ask for the discount that deserves. The first uses exactly the Little residual from the third step as a differential diagnosis in queues under attack: it separates overload from attack with an area under the curve of 1.000, against 0.21 to 0.33 for monitors that only look at magnitude. The second deals with a problem anyone who operates long-running agents knows: deciding, from the outside, whether the agent is stuck or merely slow — and argues that no purely observational detector solves that, only a cooperative protocol with two clocks. Neither one is published; when they are, the link goes here.
One more piece of honesty: the bridge between the formal Theory of Constraints and agent infrastructure barely exists in public discussion. I looked. The arXiv study describes the phenomenon without the vocabulary; the local-model forums talk about VRAM bottlenecks, not about Goldratt. The bridge is mine, and I offer it as such — not as common sense in the field.
The business chapter: Ford, Spanx and Kit, checked
The newsletter closes with three cases. Each one went through the check before it came in here, and the result is different for each one.
Ford: the number is almost right, and the reading is wrong
"That took 12.5 hours per car. [...] Assembly dropped from 12.5 hours to just 90 minutes. An incredible 8X increase in throughput."
I went to the primary source — Ford's own autobiography, My Life and Work (1922), chapter "Getting Into Production". The best chassis assembly time with the car standing still was 12 hours and 28 minutes. Then comes an experiment the newsletter does not tell and that is the best part: Ford drew the chassis down a 250-foot line with a rope and a windlass, with six assemblers walking alongside and picking parts from piles along the way — literally a rope — and the time fell to 5 hours and 50 minutes. Only in early 1914, with the line raised to waist height and the work subdivided, did it reach 1 hour and 33 minutes: 93 minutes, not 90.
Barry's "8X" is right — 748 minutes divided by 93 gives 8.04. What is rounded is the finish point. And there is a real institutional divergence, which I report instead of resolving: The Henry Ford museum and the Library of Congress say 93 minutes, matching the 1922 text; Ford Motor Company's corporate site, in a 2020 article, says "ninety minutes" without citing the starting point.
It is the reading that changes. The newsletter tells the case as "effort at the bottleneck". What Ford's text describes is something else: he did not speed up the assemblers — he changed what moves and, with that, the rule that decides when each part reaches each man. It is a change of release policy, not of capacity. Ford built a rope before Goldratt was born.
Spanx: an account, not a fact
"Manufacturing was going well but people simply didn't understand the product. So she personally went to department stores and demonstrated it [...] until the buyers got it."
I did not check this case in a primary source and I am not going to pretend I did: it stays here as an account attributed to Nathan Barry. What it illustrates, if it happened as told, is the kind of constraint Goldratt says is rare and almost always mistaken for something else: a real market constraint — the buyer does not understand the product — solved in the place where it actually was, and not at the factory, which "was going well". It is step 1 done right: the queue was not where intuition told you to look.
Kit: step 3, told by whoever did it
"So they stopped scaling, which sounds obvious. But the counterintuitive part is the team didn't just keep things where they were at. They actually limited the program way down to focus on just a handful of creators and a handful of brands."
This is the most valuable case in the piece, and it is the only one the author lived through. Kit's sponsorship program was growing; operations became the constraint; the team deliberately shrank the program until the few relationships that were left hit their targets, and only then scaled back up. That is subordination — step 3 — practiced with the rope deliberately short, and it is exactly the step the public series does not cover. Then came the sentence that closes the newsletter: one bottleneck solved, the next one appeared. That is step 5. Barry wrote the two steps missing from the series without naming them; I am only putting the name on them.
I report it the way he reports it: an account from the executive himself, with no numbers and no counterfactual. I do not know how much revenue Kit lost while the rope was short — and it is exactly that number, the 5% from my simulation, that separates a decision like that from a good-looking sentence.
The scoreboard of the check
| The claim in circulation | What the source or the measurement says | Verdict |
|---|---|---|
| Effort outside the bottleneck makes the bottleneck worse | Output does not change (-0.3%, noise); waiting grows 33% faster; under the rope, it helps +1.6% | ⚙️ Half-truth: it worsens the waiting, not the output |
| "It's never going to exceed the constraint" | Demand from 3.5 to 7.0: throughput locks at 4.0; the queue rises 9,000 times | ✅ Confirmed |
| Freeway 8 -> 4 lanes: "far more traffic, and less throughput" | Capacity drop is real, from 5% to 10%; the alleged mechanism is not what was found; the exact comparison was never tested | ⚙️ Real phenomenon, wrong magnitude and mechanism |
| Ford: 12.5 h -> 90 min, 8× | 12 h 28 -> 1 h 33 (93 min); 8.04× | ⚙️ Almost: the finish point is rounded |
| The Goal, 1984, five steps | The first edition is Excellence in Manufacturing; the five steps are from the 1990 book | ❗ Right book, list in the wrong book |
| Spanx, Kit | Accounts from the author | ⚪ Not checkable — cited as accounts |
None of this is a debunking. Barry and Forte are on the right side of the argument, and the credit to them is explicit. The correction is one of degree, not of merit — and degree is where the business decision lives.
What I would do with this
Find the place before you spend the effort. The constraint is where the queue is right now. Make the work in process visible — cards, tickets, orders, whatever it is — and look at where it piles up. Do not ask who is busiest; ask in front of whom things are waiting.
Measure three separate things: throughput, waiting and work in process. The catchphrase fuses the three, and the wrong decision is born of the fusion. Little's Law tells you whether your three measures are consistent; when they stop being, demand has gone past the constraint.
Before speeding anything up, ask whether it sits before or after the constraint. If it is before, you are buying queue. If it is after, you are buying idleness. In both cases the output stays where it was. The only effort that turns into output is the one that lands on the place.
Put the rope in, and accept the price. Limiting how much gets in costs throughput — 5% in my model — and it buys a lead time thousands of times smaller. If your operation cannot stand seeing people standing still on purpose, it will stand customers waiting; it is the same bill, paid by somebody else.
When the constraint breaks, review the rules. The policies that were born because of the old bottleneck are the new bottleneck. That is the warning in step 5, and it is the half of the theory that the circulating version loses.
For anyone operating agents: instrument by station, not by model. The bottleneck moves between inference, tools, database and human review, and swapping models is speeding up the wrong station often enough to deserve a measurement first. And look at the threshold before you look at the architecture — in a problem I measured, the scalar was worth a hundred times more.
The last word is a ruler. The constraint is the place where the queue is right now, measured by you this week — not the place that a 1984 book, a 2016 series or a newsletter from today remember having seen.
Verification note. The simulation numbers were generated by me on August 25, 2026 by the script published alongside this article (pure Python, seed 20260825, 400,000 items per run), from the results file it writes — none was copied from a note. The simulator passes four self-tests against the closed-form formula from queueing theory, with a 0.03% error in the long run. Ford's text was read in the 1922 edition on Project Gutenberg; the first edition of The Goal was checked in a bibliographic catalog (WorldCat and the Internet Archive); the wording of the five steps comes from the official text published by North River Press and signed by Goldratt, adapted from the 1990 book — the full book was not read: the Internet Archive copy is restricted-access and the printed edition was not at hand. The capacity drop numbers come from Hall and Agyemang-Duah (1991), Banks (1991) and Cassidy and Bertini (1999), read in the primary sources; the 7% default value from the Highway Capacity Manual comes from a secondary synthesis; the Minnesota ramp meter study, from the department of transportation report. The academic criticisms of TOC were read in the section that cites them, not in the full papers. The newsletter's original text was extracted from the page published on August 25, 2026; Forte's series was read in Wayback Machine copies, because Medium blocks automated reading. The Spanx and Kit cases were not checked beyond the author's account. I did not measure the reception of the series on Reddit.
Sources
- Nathan Barry, Obsess Over Your Bottlenecks (Kit, 25/08/2026)
- Tiago Forte, série Theory of Constraints (Praxis, 2016-2017): index · 101 · 102 · 103 · 104 · 105 · 106 · 107 · 108 · 109, 110 and 111 behind the Praxis paywall
- Eliyahu M. Goldratt, The Five Steps of Focusing — official North River Press text, adapted from What Is This Thing Called the Theory of Constraints and How Should It Be Implemented? (1990, ISBN 0884270858)
- North River Press, Eliyahu M. Goldratt (1947-2011)
- Goldratt and Cox, The Goal: Excellence in Manufacturing (1984) — WorldCat OCLC 12721255; 1986 revision, Internet Archive
- Henry Ford and Samuel Crowther, My Life and Work (1922), chapter V
- The Henry Ford, Ford Methods and the Ford Shops · Library of Congress, This Month in Business History · Ford Motor Company, The Moving Assembly Line and the Five-Dollar Workday
- John D. C. Little, A Proof for the Queuing Formula: L = λW, Operations Research 9(3), 1961
- J. H. Banks, Two-Capacity Phenomenon at Freeway Bottlenecks, TRR 1320 (1991) · F. L. Hall and K. Agyemang-Duah, Freeway Capacity Drop and the Definition of Capacity, TRR 1320 (1991) · M. J. Cassidy and R. L. Bertini, Some traffic features at freeway bottlenecks, Transportation Research B 33(1), 1999
- McTrans Center, Analyzing Active and Hidden Bottlenecks (HCM default value)
- Minnesota DOT, Twin Cities Ramp Meter Evaluation (2001)
- From LLM Inference to Agentic Workloads: Characterization and Implications for Serving Systems (arXiv, 15/08/2026)
- Ulisses Flores, Operating-Point Dominance — 10.5281/zenodo.21708708 · repository
- Academic criticism: D. Trietsch, From the Flawed "Theory of Constraints" to Hierarchically Balancing Criticalities (2004, Wayback copy — the original host does not respond) and Human Systems Management 24 (2005) · A. Linhares, Theory of constraints and the combinatorial complexity of the product-mix decision, IJPE 121(1), 2009 · M. Gupta and D. Snyder, Comparing TOC with MRP and JIT: a literature review, IJPR 47(13), 2009 · D. Nave, How to compare Six Sigma, Lean and the Theory of Constraints, Quality Progress 35(3), 2002
- This article's simulator:
fila.pyandresultados.json, published alongside the text
Verified on August 25, 2026. The simulation numbers are reproducible with the script and the seed indicated; the traffic, Ford and Little numbers were checked against the sources listed; whatever was not checked is declared as such in the body.