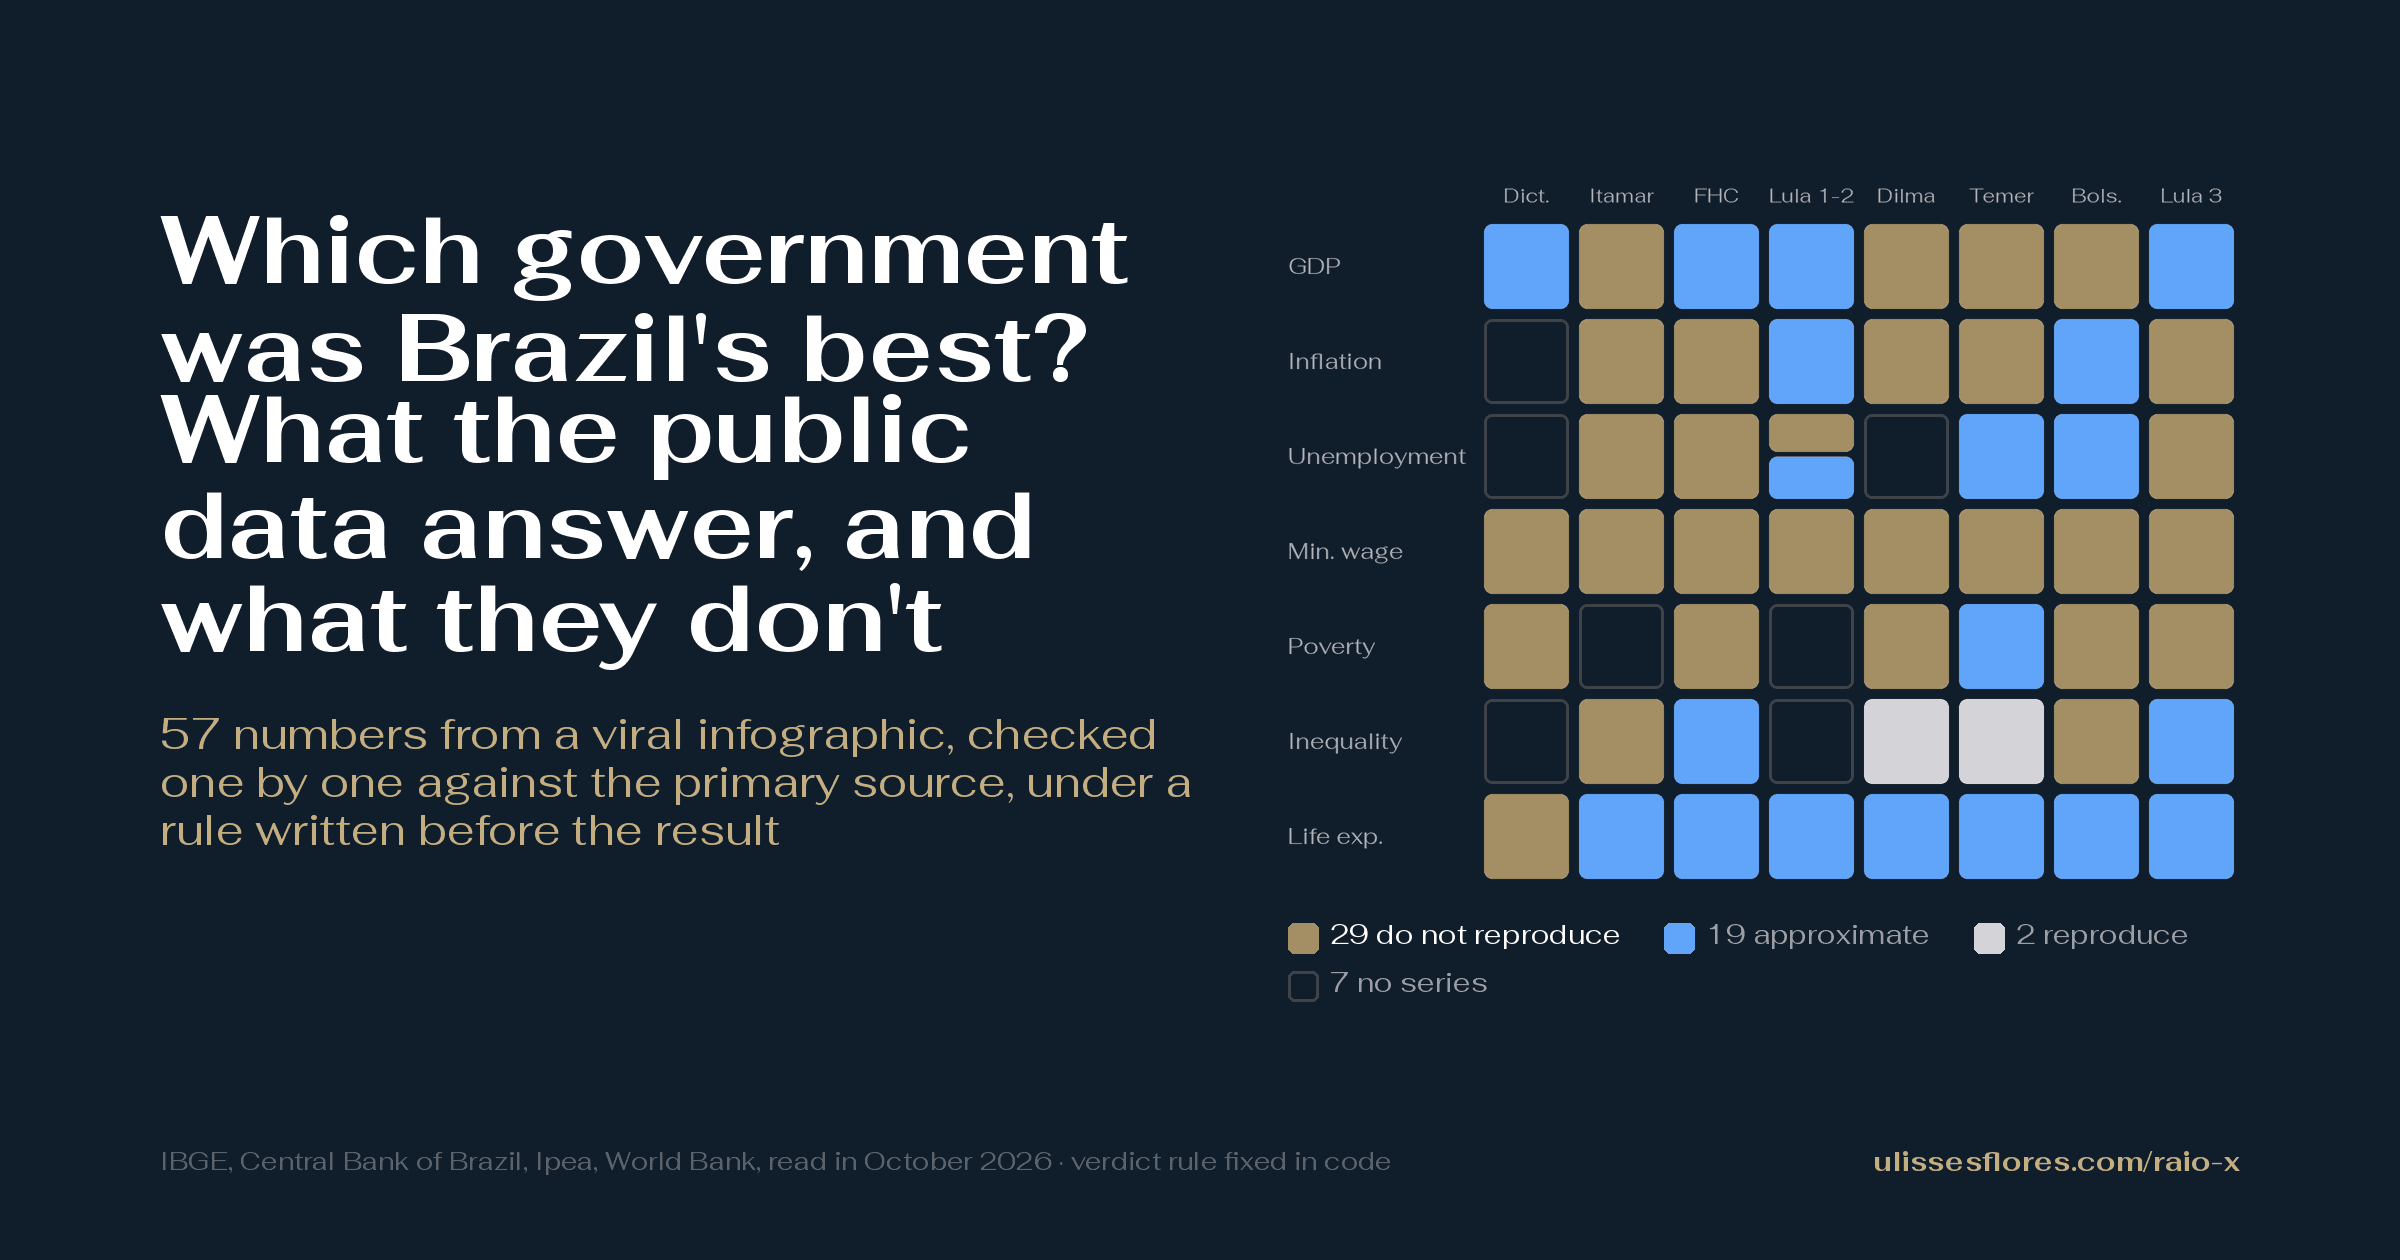
The image that circulated can't answer it: 29 of its 57 numbers do not come out of the public data. Seventeen of those don't come out under any calculation I tested, and the image leaves out five governments.
The image reached me on WhatsApp on October 19, 2026. The oldest post I found is on X, from October 18, with a caption that, translated from the Portuguese, reads "I asked ChatGPT which was Brazil's best government?"
With the public data, only in part. In an index written before the calculation, only the first and last positions separate when the weights change. The middle of the table (Dilma, Temer, Bolsonaro) does not separate, and the index describes the country, not the merit of the government. Failing to reproduce does not prove the image lied: under another poverty line or another window, 12 of the 29 fall within tolerance.
Five governments are left out, and they add up to 34.3% of the months
The gold hatched blocks are the governments the infographic does not have.
Between 1964 and 2026, the image covers 8 of 13 heads of government and leaves out 34.3% of the months.
The five omitted are Castelo Branco, Geisel, Figueiredo, Sarney and Collor: 257.6 months out of 750.1. The dictatorship header says 1967-1974, but the GDP uses 1968-1973 and inflation, 1967-1973. Also left out is everything beyond the scoreboard's seven indicators: the repository publishes 101 series across 19 domains, and the image carries none of them.
Methodological note. The criterion is in code (
verdict.py) and was fixed before the result. Reproduces: rounded to the printed decimals, it matches. Approximates: within 0.3 percentage point (the difference between percentages) on rows in %, or 5% relative. Does not reproduce: beyond that. No series: no official series covers the window.One specification per indicator; the rest is sensitivity. GDP: IBGE (Brazilian Institute of Geography and Statistics) and Ipeadata. IPCA (the official inflation index): series 433 of the SGS, the Central Bank's catalog. Unemployment: PME (Monthly Employment Survey) and PNAD Contínua (Continuous National Household Sample Survey). Real wage, December to December: Ipea (Institute for Applied Economic Research). Poverty and Gini (an index from 0 to 1: the closer to 1, the more unequal the income): the World Bank's PIP (Poverty and Inequality Platform), at US$6.85/day in PPP (purchasing power parity). Life expectancy: UN, via the World Bank.
Each download enters
manifest.jsonlwith the hash (a file's fingerprint) of the previous line, and the SHA-256 seal (the algorithm behind that fingerprint) is checked withpython3 make_provenance.py --verify. Nothing is estimated, imputed (filled in with an assigned value) or interpolated (drawn as a line between two known points); a series with a method break is not spliced. The preregistration (a rule sealed before the calculation) has 13 dated amendments; before downloading, only the list of what the image omits was sealed, and the specifications came after an exploratory pass. DOI is the permanent identifier of the deposit. The same design is in how I checked the 2026 election polls.
Twenty-nine numbers do not come out of the chosen series
Of 57 numbers, 2 reproduce, 19 approximate, 29 do not reproduce and 7 have no series.
Of the 50 with a series, 21 fall within tolerance and 29 fall outside.
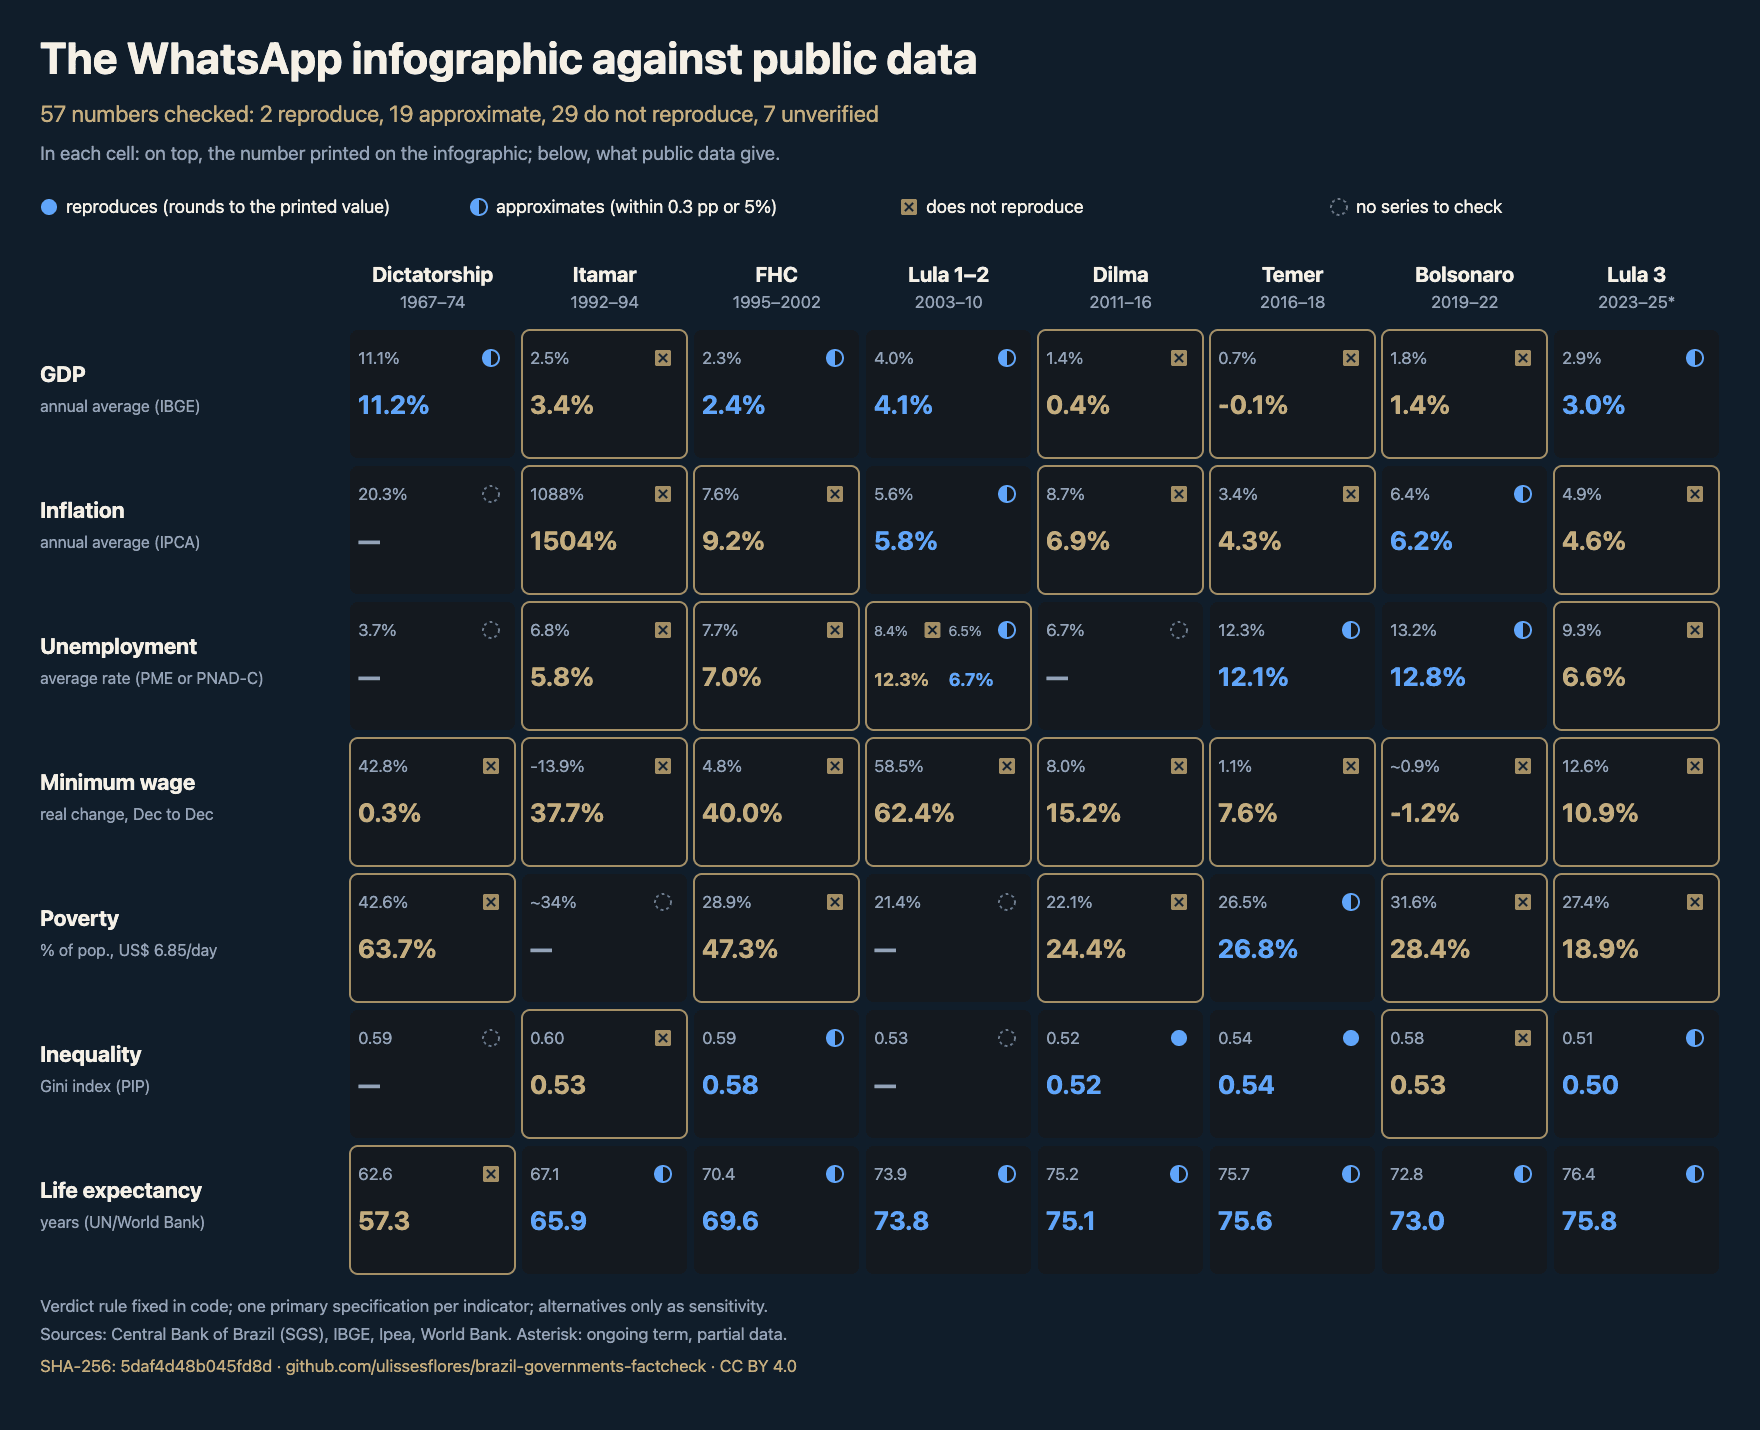
Each gold frame surrounds a cell that does not reproduce. In each cell, the small number is the printed one and the large one is what comes out of the public data. The two solid blue circles are the Ginis that close, 0.52 (2014) and 0.54 (2018). Cell by cell, on the check page.
| Indicator | Reproduces | Approximates | Does not reproduce | No series |
|---|---|---|---|---|
| GDP | 0 | 4 | 4 | 0 |
| IPCA | 0 | 2 | 5 | 1 |
| Unemployment | 0 | 3 | 4 | 2 |
| Real minimum wage | 0 | 0 | 8 | 0 |
| Poverty | 0 | 1 | 5 | 2 |
| Gini | 2 | 2 | 2 | 2 |
| Life expectancy | 0 | 7 | 1 | 0 |
| Total | 2 | 19 | 29 | 7 |
There is a caveat the table does not show: I also tested each row with alternative calculations: another poverty line, a window shifted by one year, annual average instead of December to December. Of the 29 that do not reproduce on the primary calculation, 12 fall within tolerance under some alternative. The other 17 do not come out of the public data under any I tested.
Two examples of the 12. FHC's inflation, printed as 7.6, comes out 9.25 on the primary calculation and 7.37 with the 1996-2002 window. Bolsonaro's poverty, printed as 31.6, comes out 28.45 at US$6.85 a day and 30.58 at US$8.30.
On the longest gold bar, the minimum wage does not reproduce in any of the eight cases. The image does not say whether the wage calculation is real. On the real December-to-December change, from Ipea, the dictatorship's 42.8 (1968-1973) comes out 0.29. Itamar's -13.9 (1992-1994) comes out 37.69, and FHC's 4.8 (1995-2002) comes out 40.05.
Unemployment has nine cells because Lula 1-2 prints two rates, 8.4 and 6.5. Seven have no series. The 20.3 (1967-1973) has none because the IPCA only starts in 1980; the unemployment 3.7, because there is no official series in the window. An empty chair is not a zero.
Also not reproducing are Itamar's IPCA (1,088 against 1,504.22) and Dilma's GDP (1.4 against 0.43). Temer's GDP does not either: 0.7 against -0.06.
The caption that cites ChatGPT is the post author's, not authenticated: a caption is not a source. Another WhatsApp chain, checked at the source: nobody proved that Meta reads WhatsApp.
Since the Real Plan, only the first and last positions separate
By the close of the country-conditions index, since the Real Plan (the stabilization plan that created the real currency): 6th FHC (33.6; keeps its place in 100% of the 10,000 draws of weights); 5th Dilma (57.5; 61%); 4th Temer (58.8; 72%); 3rd Bolsonaro (63.9; 64%); 2nd Lula 1-2 (75.4; 81%); 1st Lula 3 (83.0; 88%). The order is that of each term's last year in the index, not of the government's merit. Dilma, Temer and Bolsonaro do not separate: the bands from the 5th to the 95th percentile overlap.
Two more cautions, beyond the index describing the country's conditions and not merit. First, ten items are long trends, such as life expectancy, infant mortality and GDP per capita, which rise almost every year and favor whoever governs later.
Second, on two V-Dem (Varieties of Democracy) items the 2024 value is itself the "best" benchmark of 1995-2024. They are judicial constraints on the executive (v2x_jucon), at 0.954, and political corruption (v2x_corr), at 0.438. Part of the jump in Institutions under Lula 3 is the ceiling of the scale.
There are 35 items in 12 areas, from 0 (worst of 1995-2024) to 100 (best). The direction comes from a Q1 article with a DOI (Q1 is the top quarter of the SJR 2024, a journal ranking). Homicide, inflation and debt are inverted. Equal weight per area is a stated judgment; the adjustment by effective importance did not converge.
The 10,000 draws (seed 20261020) give the band from the 5th to the 95th percentile. Each term is a trading candlestick (a candle, as in price charts). FHC opens in 1995, with no 1994; Temer opens at 71.8 (2015), not at the 57.5 of 2016, because he took office in August.
Each candlestick has a body and, beside it, a gold bracket. The filled body closed above the open; the hollow one, outline only, below, as in Dilma and Temer. The brackets of Dilma, Temer and Bolsonaro overlap.
| Term | Open | Close | High | Low | p5 | p95 | Rank | Keeps its rank (draws) |
|---|---|---|---|---|---|---|---|---|
| FHC | 30.2 | 33.6 | 42.4 | 30.2 | 27.1 | 40.2 | 6th | 100% |
| Lula 1-2 | 33.6 | 75.4 | 75.4 | 32.8 | 67.6 | 81.6 | 2nd | 81% |
| Dilma | 75.4 | 57.5 | 77.2 | 57.5 | 44.4 | 69.0 | 5th | 61% |
| Temer | 71.8 | 58.8 | 71.8 | 57.5 | 46.7 | 70.6 | 4th | 72% |
| Bolsonaro | 58.8 | 63.9 | 64.4 | 53.0 | 51.8 | 73.4 | 3rd | 64% |
| Lula 3 | 63.9 | 83.0 | 83.0 | 63.9 | 71.7 | 91.3 | 1st | 88% |
Since the Real Plan, only the first and last positions separate in the draws; the index describes the country, not the merit of the government.
Rises: Labor goes from 14.9 to 84.1 in Lula 1-2 and closes Lula 3 at 100.0. Falls: Institutions goes from 76.8 to 34.1 in Dilma and from 76.4 (2015) to 21.5 in Temer. Repeats: Fiscal and vulnerability rises to 71.0 at the close of Lula 1-2 and falls in every later term, to 38.5 in 2024. The figure carries the score for each area.
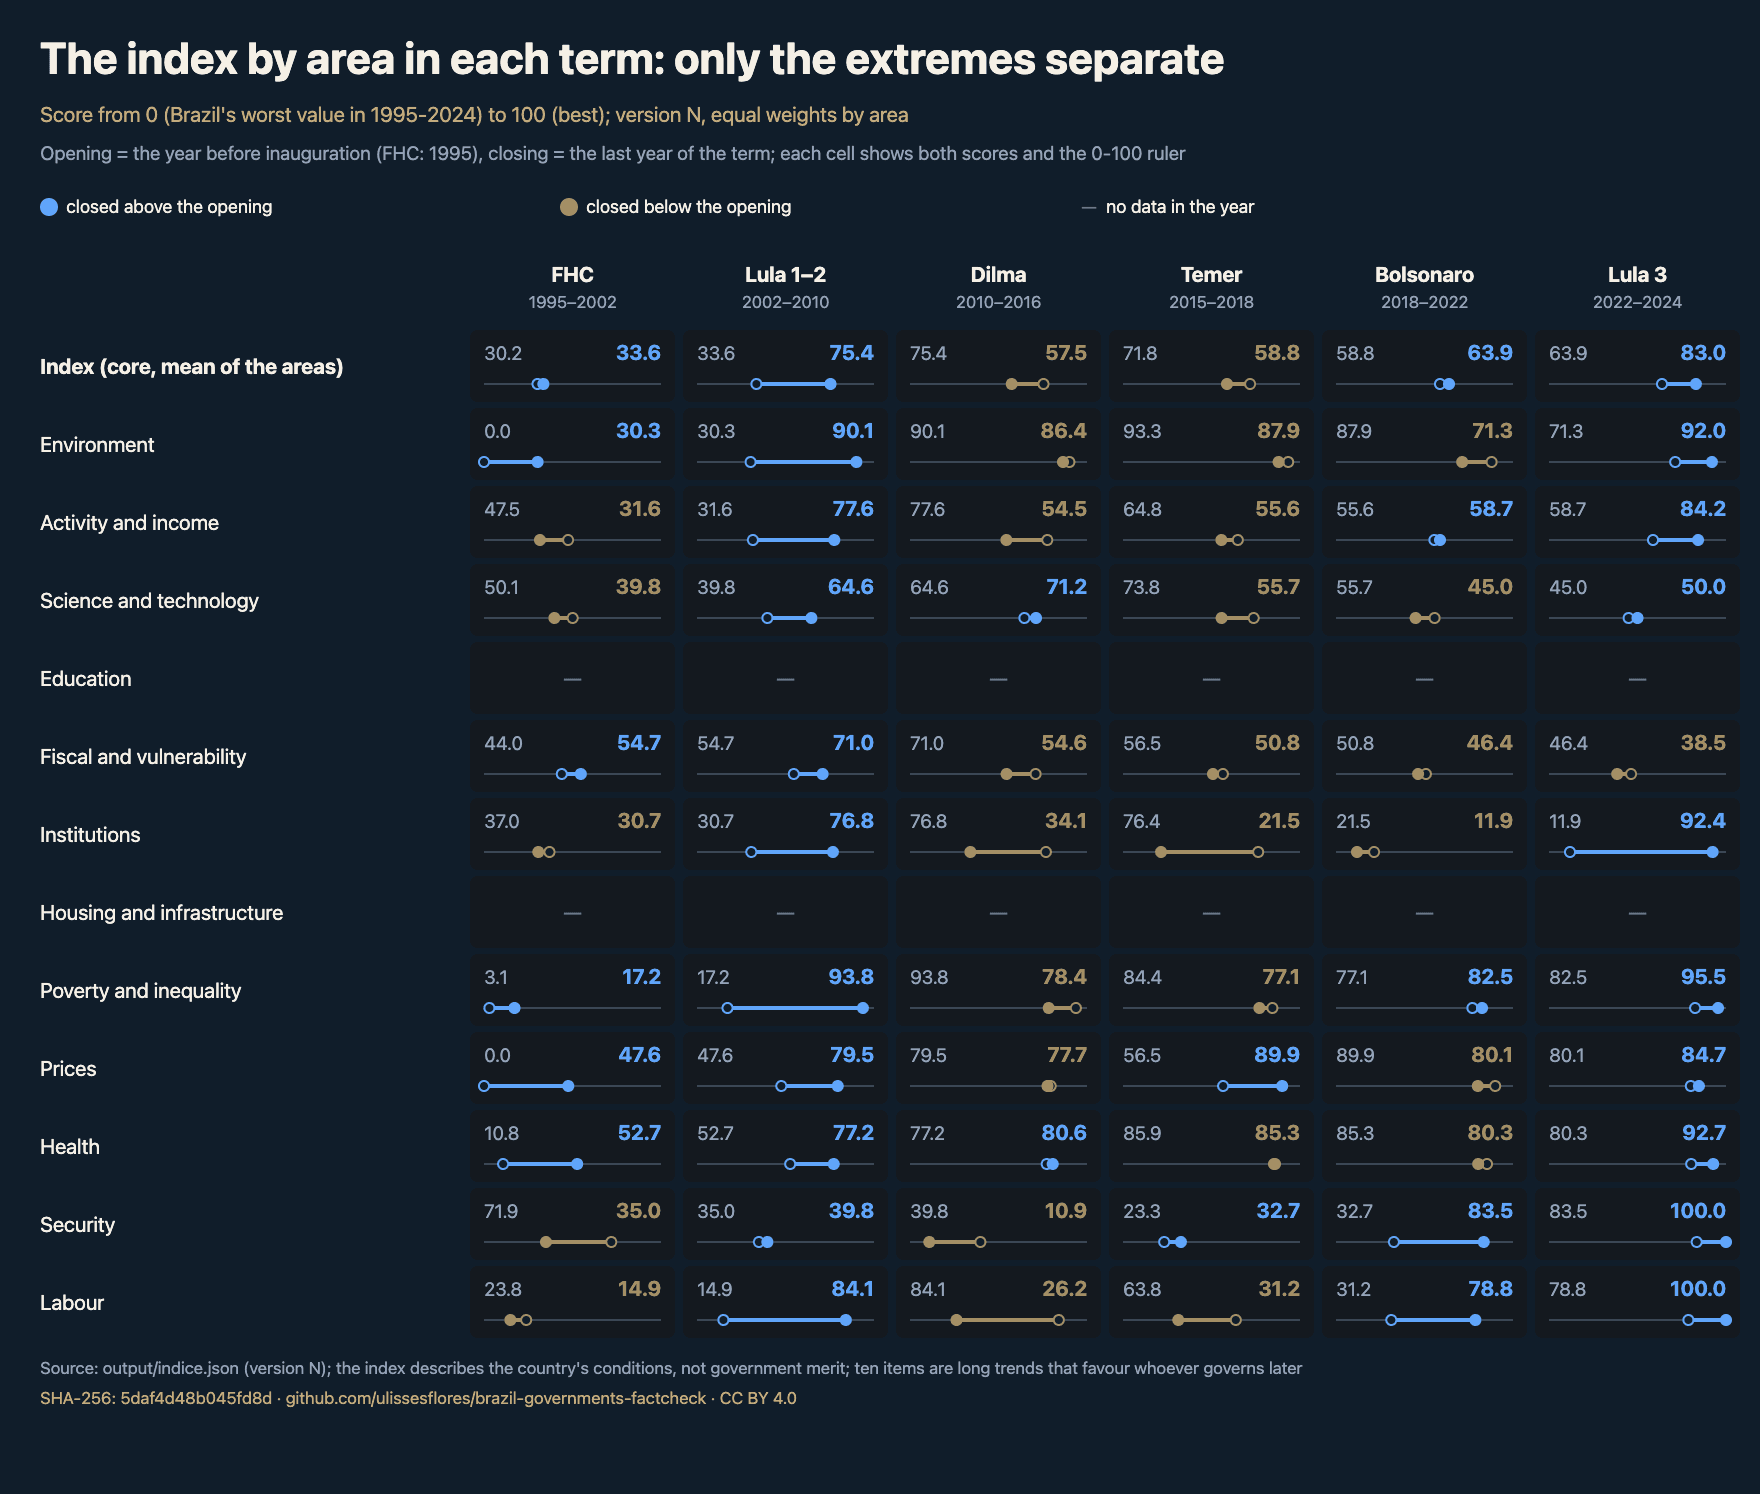
1996, 1998 and 2000 are missing (fewer than 70% of the items have data). Five items stop in 2014-2015, because the continuous PNAD does not overlap the old one and the preregistration forbids chaining. For 2025 and 2026 only the last value carried forward exists, which is not the index; that is why Lula 3 closes in 2024.
The institutional floor describes the country; the cause stays open
The independence of the branches of government is already in the index, in four measures from V-Dem v16. V-Dem aggregates experts' coding through a measurement model, publishes uncertainty bounds, and each release re-estimates the whole series.
| Item (0 to 1) | 1994 | 2002 | 2010 | 2016 | 2018 | 2022 | 2024 | Benchmarks 1995-2024 (worst and best) |
|---|---|---|---|---|---|---|---|---|
| Judicial constraints on the executive (v2x_jucon) | 0.825 | 0.825 | 0.93 | 0.872 | 0.859 | 0.827 | 0.954 | 0.806 and 0.954 |
| Legislative constraints (v2xlg_legcon) | 0.831 | 0.831 | 0.902 | 0.83 | 0.792 | 0.822 | 0.933 | 0.778 and 0.937 |
| Liberal democracy (v2x_libdem) | 0.707 | 0.721 | 0.776 | 0.653 | 0.608 | 0.54 | 0.712 | 0.528 and 0.783 |
| Political corruption (v2x_corr; lower is better) | 0.511 | 0.545 | 0.494 | 0.535 | 0.535 | 0.545 | 0.438 | 0.546 and 0.438 |
The editor asked for one more indicator after the index was published. It is v2x_freexp_altinf, Freedom of Expression and Alternative Sources of Information. It is context on the terminal page and does not score (EMENDA-13, an amendment to the preregistration, October 25, 2026). Including an item after seeing the result is what the preregistration prevents.
Point estimate: 0.924 in 1995, 0.931 in 2010, 0.809 in 2016, 0.704 in 2022, 0.923 in 2024. Liberal democracy already contains freedom of expression.
The editor's hypothesis is in EMENDA-12, October 25, 2026, registered before searching. For him, the Central Bank's autonomy and the legal spending limits "in a way keep things from getting worse". This article neither asserts nor tests it: only peer-reviewed studies speak.
Round 11: 54 queries, 7,487 papers returned, 43 included. In the four new episodes, 1, 4, 1 and 0 passed; judicial independence, none.
Words of the episode in the title or in the result sentences: none. The studies that passed, by episode:
- Autonomy: Alice Amsden (Development and Change, 2008), a text with the author's name in the title.
- Fiscal rules: The effects of intergovernmental transfers on the local fiscal incentives of Brazilian municipalities (2024); Intergovernmental transfers and fiscal performance: evidence from Brazil (2026); Municipal Secession and Transfer Incentives in Brazil (2026); Sales vs. profit-based royalties: Evidence from lithium in LAC countries (2025).
- Press: "Yes, I Saw It – But Didn't Read It…" (2020).
They passed by naming an identification design (the method a study uses to separate effect from coincidence), not by measuring the episode.
The hypothesis stays open in the Q1 literature with an identification design on Brazil.
What this article brings is description: December-to-December inflation and the debt series. The cause is left to the reader.
The sign changes depending on which neighbor you pick
The calculation is the same on all three sides: average of the term's years, same series and source, no sum and no score. The comparison with the world starts in 1995; left out are the five omitted governments and also Costa e Silva, Medici and Itamar. Real GDP growth, in % per year:
| Term | Brazil | Latin America and the Caribbean | Upper-middle income |
|---|---|---|---|
| FHC | 2.4 | 2.3 | 4.7 |
| Lula 1-2 | 4.1 | 3.8 | 7.2 |
| Dilma | 0.4 | 1.7 | 5.4 |
| Temer | 1.6 | 1.4 | 5.2 |
| Bolsonaro | 1.4 | 1.2 | 3.7 |
| Lula 3 | 3.0 | 2.3 | 4.3 |
On growth, only Dilma falls below Latin America and the Caribbean; all fall below upper-middle income.
On life expectancy, the neighbor flips the sign. Bolsonaro, at 74.6 years, is above Latin America and the Caribbean (73.7) and below upper-middle income (75.2). Lula 3, at 75.9, is level with upper-middle income (76.0) and above the other (75.7).
The Real Plan goes into the filter and comes out with zero
This layer does not measure whether a policy worked. An article gets in if it has a DOI registered at Crossref, is from a Q1 journal, has Brazil in the title or abstract, and names an identification design in the abstract.
Of 7,487 papers, 2,909 left without a DOI and 2,625 for being outside the SJR 2024. Other cuts removed the rest, leaving 43 studies for the 27 episodes. Anyone who merely mentions the design passes: cutting by hand would be my judgment.
Round 10 had 6,497 papers and 38 included; four institutional episodes came in on October 25, 2026 by dated amendment. Counting studies per term would measure elapsed years and declared episodes, never the quality of the government; I don't count.
Note the bottom block, with no bars at all: each episode without a study has a written zero. For the Real Plan, 400 papers read, out of 10,734 returned; for external debt, reserves and vulnerability since 1994, 377, out of 556. None was included. Zero in this filter is not zero in the literature.
Of 7,487 papers, 43 passed the filter; the Real Plan and external debt were left with zero.
Where a study exists, the cause appears only in its own words. Three examples:
Impact of the Bolsa Família program on food availability of low-income Brazilian families: a quasi experimental study (BMC Public Health, 2016, 10.1186/s12889-016-3486-y): "higher food expenditure, higher availability of fresh foods and culinary ingredients".
Deforestation slowdown in the Brazilian Amazon: prices or policies? (Environment and Development Economics, 2015, 10.1017/s1355770x15000078): "After controlling for price effects, we find that conservation policies implemented beginning in 2004 and 2008 significantly contributed to the curbing of deforestation."
Social Security Reforms, Retirement and Sectoral Decisions (International Economic Review, 2025, 10.1111/iere.70083): "Calibrated to Brazil, the model shows that unifying pension systems and raising the minimum retirement age reduce the pension deficit by nearly 40 percent [...]". Calibrated means adjusted to the country's data: the calculation is the study's.
The headline got the balance right and swapped the name of the asset
On October 21 and 22, 2026, six outlets published the same trio, US$407.1 billion, US$402 billion and US$5.1 billion (Estadão/Broadcast, NC News, Brasil em Folhas, Cardinot, Revista Oeste and O Antagonista, the latter citing Estadão). Repetition is not a second round of reporting.
The US$5.1 billion of June 2026 is the official figure of series 3685; the US$402 billion is not the cash reserves.
The Central Bank has two gross measures, and I never add them. The restricted one, series 3684, since 1972, gathers loans, securities abroad and trade credit. It is the one in the headlines: US$407.1 billion in June 2026, the highest nominal value (in current dollars).
The BPM6 (Balance of Payments Manual, 6th edition), series 25563, since 2002, adds to that total transactions between companies of the same group and domestic securities held by non-residents. In June 2026 it stands at US$869.5 billion, which the Central Bank calls "Brazil's external debt".
The net one, series 3685, is still published. It is column M of the Central Bank's Table 31. It results from the restricted gross figure minus reserves, credits abroad and banks' holdings (what Brazilian banks have deposited abroad). Negative means creditor.
In June 2026 it stands at +5.1 billion, the first positive since September 2007 (17.0 billion); in December 2007 it was at -11.9 billion. The headline got the number right, and the "first time in 19 years" too.
The US$402 billion, however, are not the cash figure of series 3546, which stood at 367.6 billion in June 2026: they join reserves, credits and holdings, which the Central Bank subtracts. The story says the credits are already included.
The ratio to GDP, series 11409, stopped in February 2026 and I do not extend it: 46.3% in December 1984, 32.7% in December 2002, -0.9% in September 2025. The story says the net debt is below 0.3% of GDP; the calculation is the story's, and I did not run it.
On the gold line, the net debt, the value starts above zero and crosses zero in 2007. It touches it again in June 2026. The +5.1 billion of June 2026 is not comparable to the 46.3% of GDP of 1984: one is a value, the other a ratio. And the number gets revised: December 2025 came out, in the January 2026 release, as an estimate of -17.2 billion and is in the series at -8.7.
Erratum: version 1.0.0, of October 23, 2026, said that 2026 had no official value and that the headline did gross minus reserves. Both sentences were wrong: series 3685 is still up and matches Table 31 to the cent. I corrected it on October 24.
What I would do with this
I would not answer which government was best with this image: it does not have that answer. The question in the title only gets answered after saying what you want to know: conditions in the country or merit of the government.
Before forwarding the next number, I would demand three names: the series, the window and the calculation.
Without the name of the calculation (average, real December-to-December change or the level of one year), the cell is not a fact. If you want to redo it:
git clone https://github.com/ulissesflores/brazil-governments-factcheck
cd brazil-governments-factcheck
python3 run_all.py
The Python 3.11 standard library or newer is enough; the run ends with run_all: OK. If it comes out different, send it to me: I update and credit.
Checked on October 25, 2026 against the sealed repository (DOI 10.5281/zenodo.23604103), the methodology and the series of the Central Bank, IBGE, Ipea, the World Bank, OpenAlex, Crossref and SJR. On X, the harvest is a sample: the oldest post is from October 18, 2026, 19:42 UTC. I did not establish authorship or intent. No 2026 value was calculated here.
Sources
- Page with the series, the scoreboard and the index: economia.ulissesflores.com
- Public repository, with data, tests and hash chain: brazil-governments-factcheck
- Concept DOI, on Zenodo: 10.5281/zenodo.23604103. Version 1.0.0: 10.5281/zenodo.23604137
- Methodology, in Portuguese: METHODOLOGY.md
- Central Bank of Brazil, SGS 433, IPCA: series 433
- Central Bank of Brazil, SGS 3684, gross external debt, restricted concept: series 3684
- Central Bank of Brazil, SGS 25563, gross external debt, BPM6 concept: series 25563
- Central Bank of Brazil, SGS 3685, net external debt in dollars: series 3685
- Central Bank of Brazil, SGS 3546, international reserves, cash concept: series 3546
- Central Bank of Brazil, SGS 11409, net external debt to GDP, discontinued in February 2026: series 11409
- World Bank, poverty and inequality: PIP
- World Bank, development indicators: World Development Indicators
- IBGE: ibge.gov.br
- Ipea, historical series: Ipeadata
- Catalog of papers: OpenAlex. DOI registry: Crossref. Journal ranking: SJR
- X post with the image and the caption, October 18, 2026: @ffrancisconl
- Estadão/Broadcast headline, October 21, 2026 (in Portuguese): "Dívida externa cresce mais que reservas e Brasil volta a ser devedor internacional após 19 anos" ("External debt grows faster than reserves and Brazil is a net international debtor again after nineteen years")
- V-Dem v16 (Varieties of Democracy),
vdemdatapackage, tag V16 - Amendments 12 and 13 of the preregistration, sealed on October 25, 2026 in the
data/raw/preregistro/manifest.jsonlchain of the repository