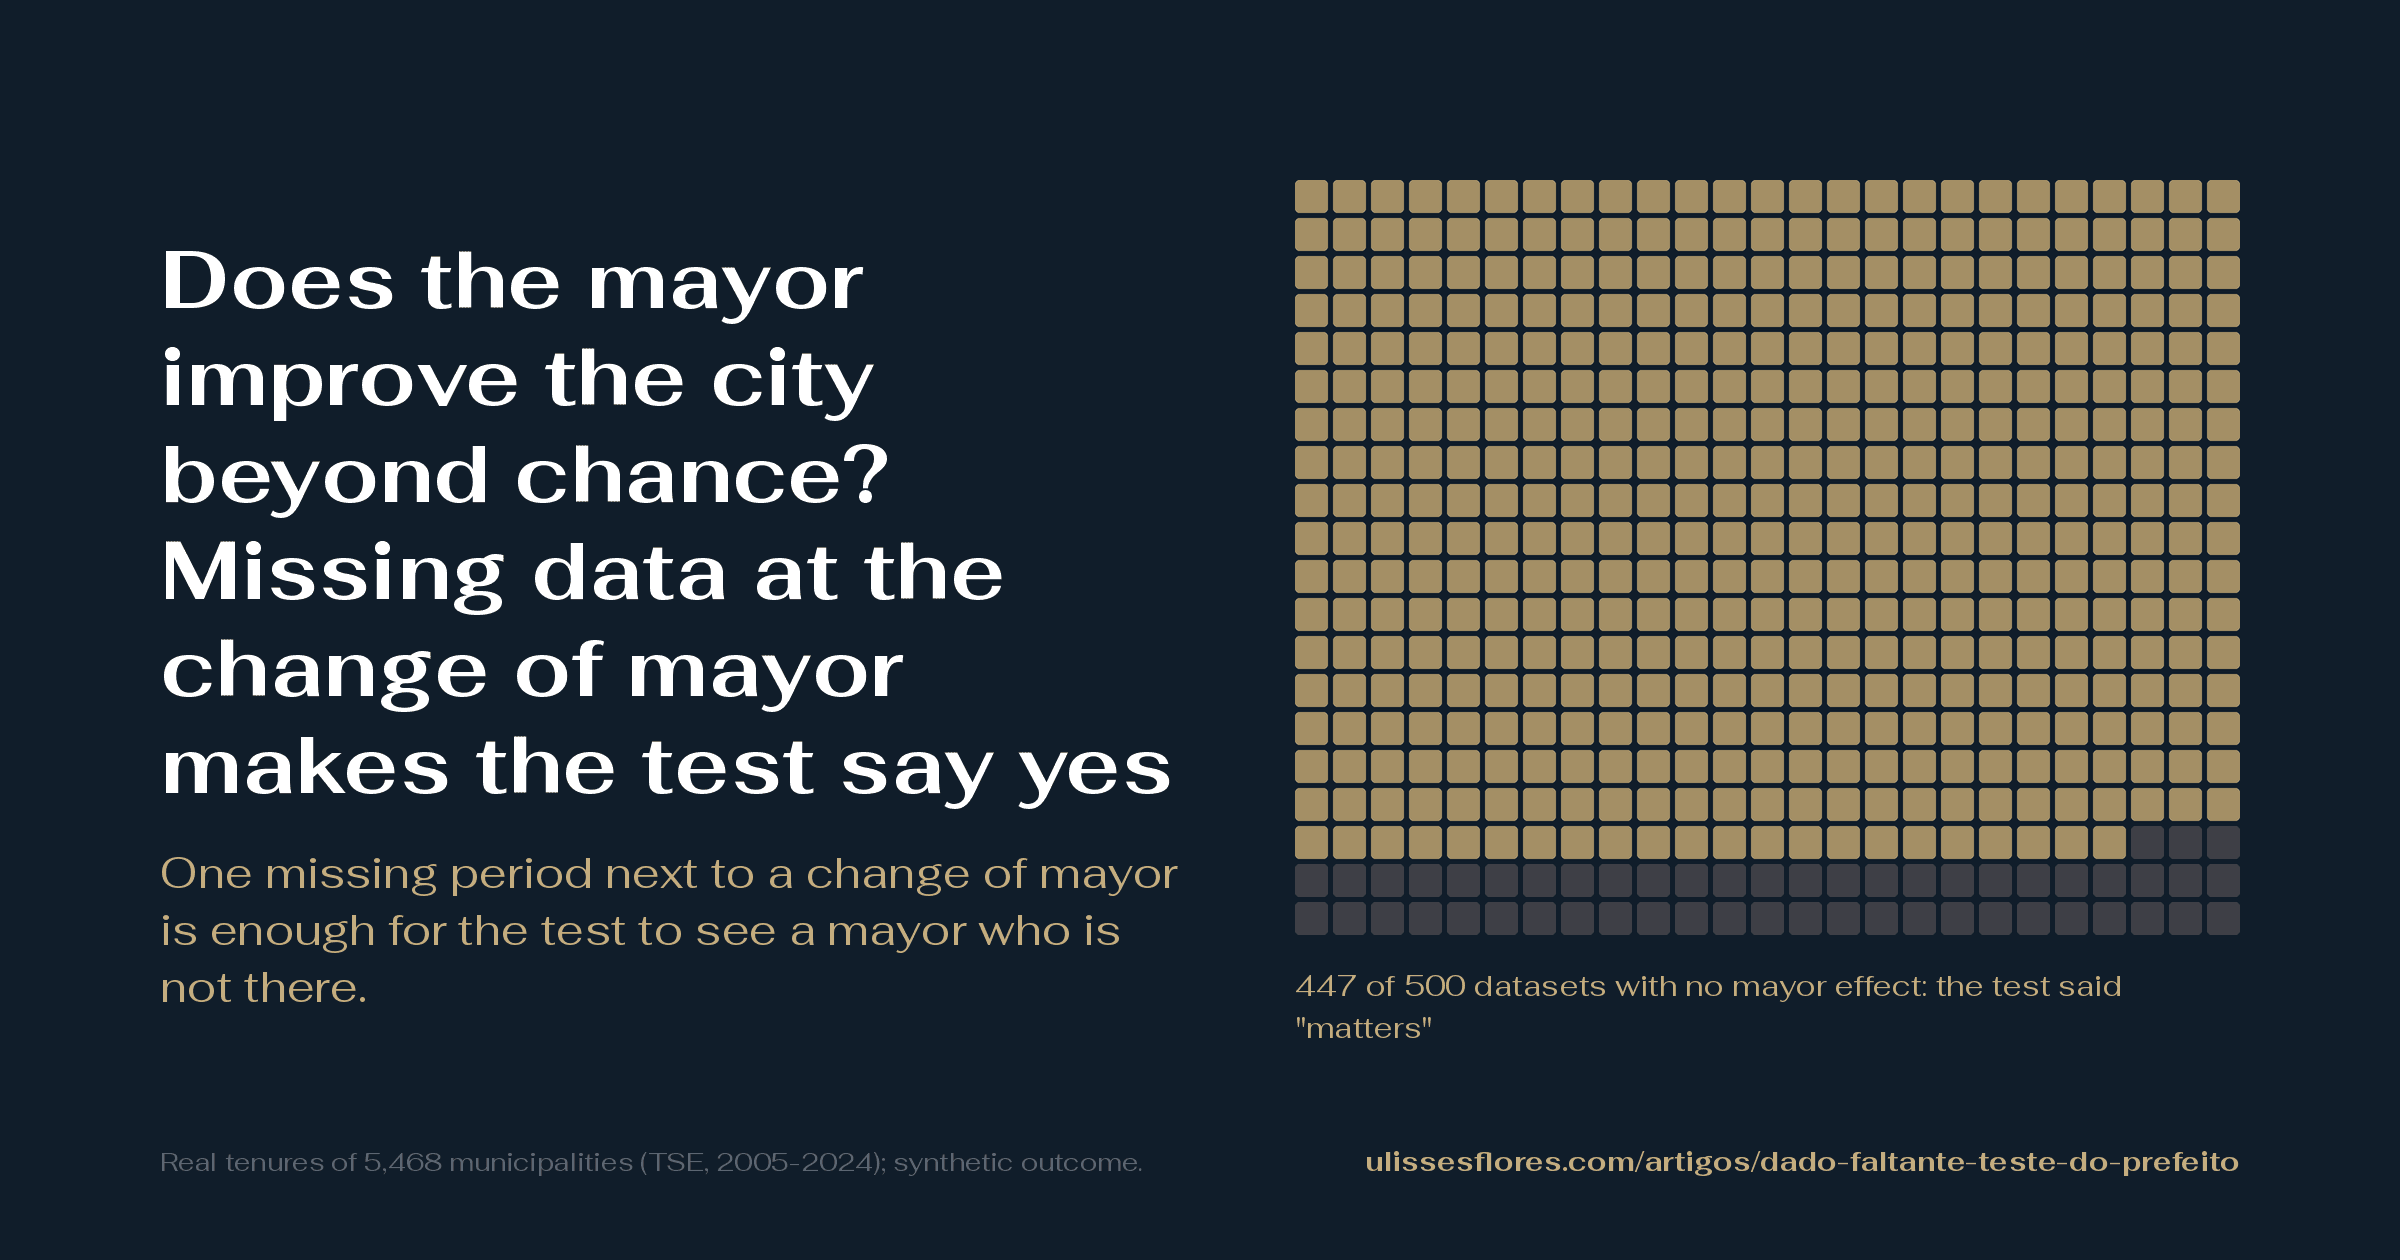
The test I used to find out whether Brazilian mayors improve their cities said yes in cities where no mayor made any difference. The test was published in Science Advances in 2021, by Christopher Berry and Anthony Fowler. I applied it to an index of school grades, own revenue and infant mortality, from 2005 to 2024. Before looking at the real mayors, I ran the test on made-up data in which no mayor made any difference. In cities with a gap in the middle of the series, it said "matters" in 64.0% of 200 simulations. An honest test would say that about 5% of the time. The study stopped.
With the gap only at the start or the end of the series, the same computation gave 5.0%. The edge kept the deal; the middle invented a mayor. This is not the first time a study of mine stops halfway because of what turns up along the way: it also happened in the refusal that stopped the study of refusals.
I did not reanalyze any published result by Berry and Fowler, and I am not saying that any of them is wrong. The fix, the nostitch option, already exists in their package. What I measured is what their simulations do not combine: a missing period, neighboring years that resemble each other, and thousands of municipalities.
Tearing a page out of a diary and gluing the neighbors together does not turn two distant days into consecutive ones
Gluing the page before to the page after does not bring back the day that was missing. It only pretends the two sides were neighbors.
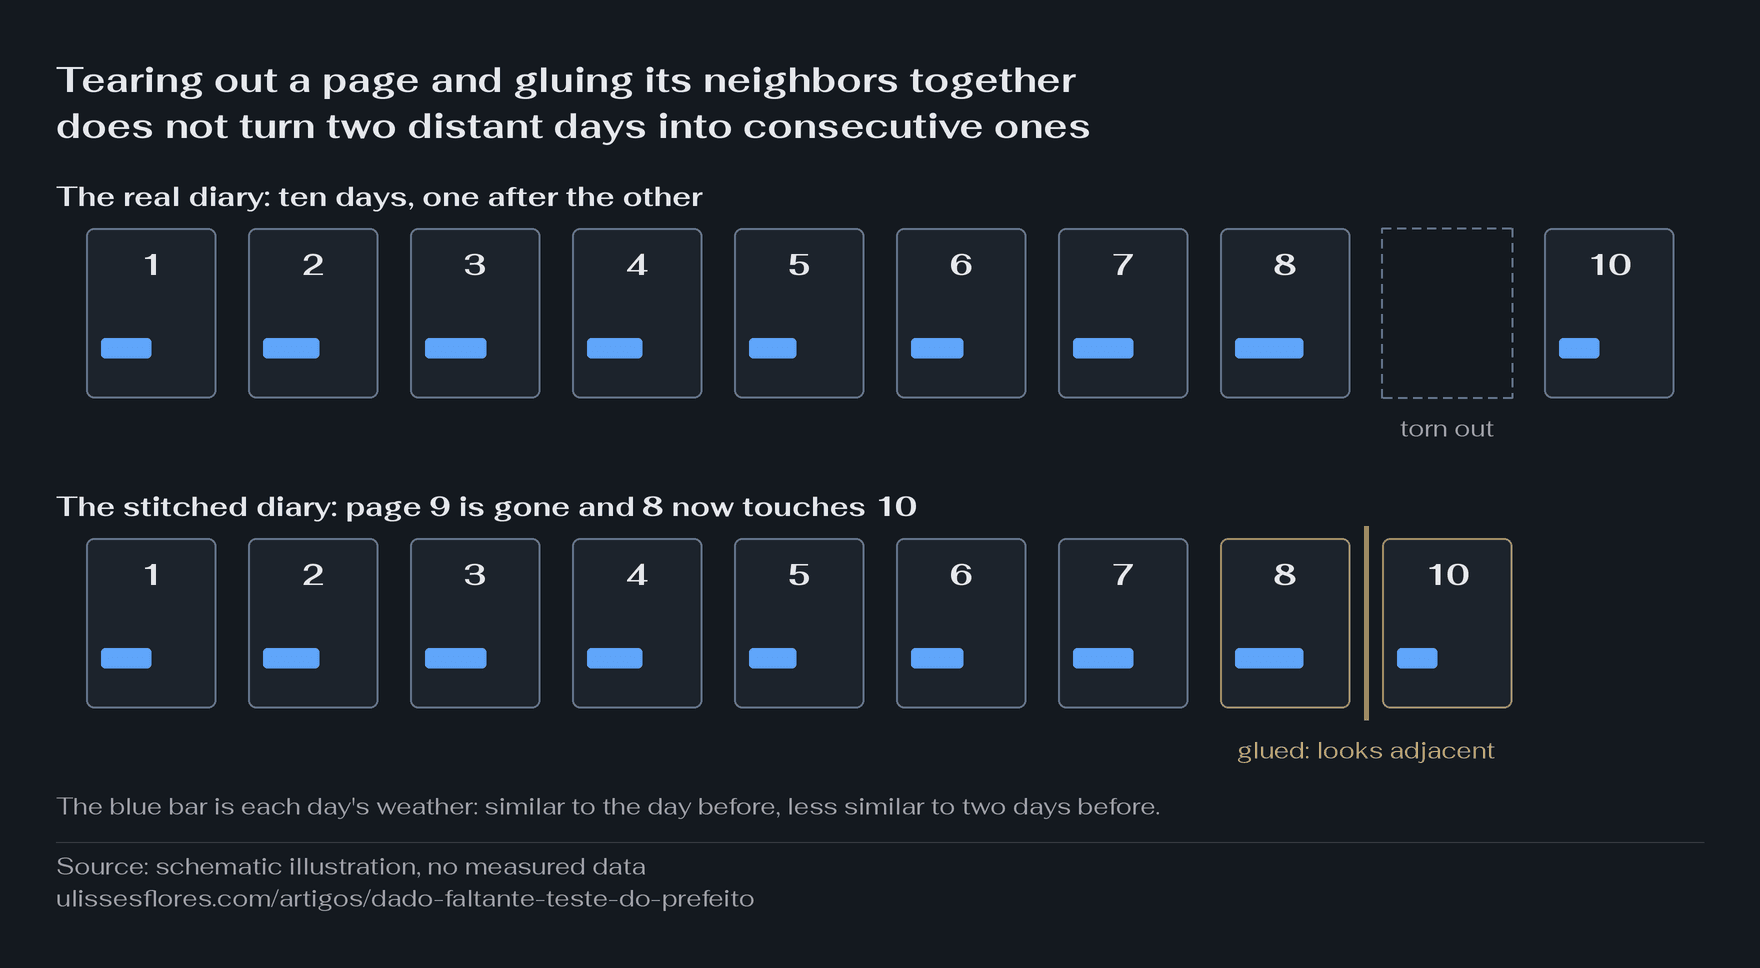
Look at pages 8 and 10 below. In the notebook, they sit side by side. On the calendar, they are two days apart. A day's weather resembles the day before and a little less the day two days before, and the glue hides that difference.
In the city, each page is a two-year half-term, and the "weather" is the city's index. School grades, revenue and infant mortality also resemble themselves from one two-year period to the next. This kinship between neighboring periods is called serial correlation (how much a period looks like the one before it). In the simulations, it is modest (coefficient 0.217, calibrated on the real index) and weakens with distance.
Berry and Fowler treat the years without data exactly like the glue in the diary. In the paper's words: "we drop those observations and stitch together blocks of time". The rifle package, for the Stata statistical software (SSC catalog, code S458461), does the same stitching by default.
The test shuffles the order of the terms and asks whether the real order explains more
The test does not measure whether the city improved. It measures whether the true order of the mayors explains the index better than shuffled orders.
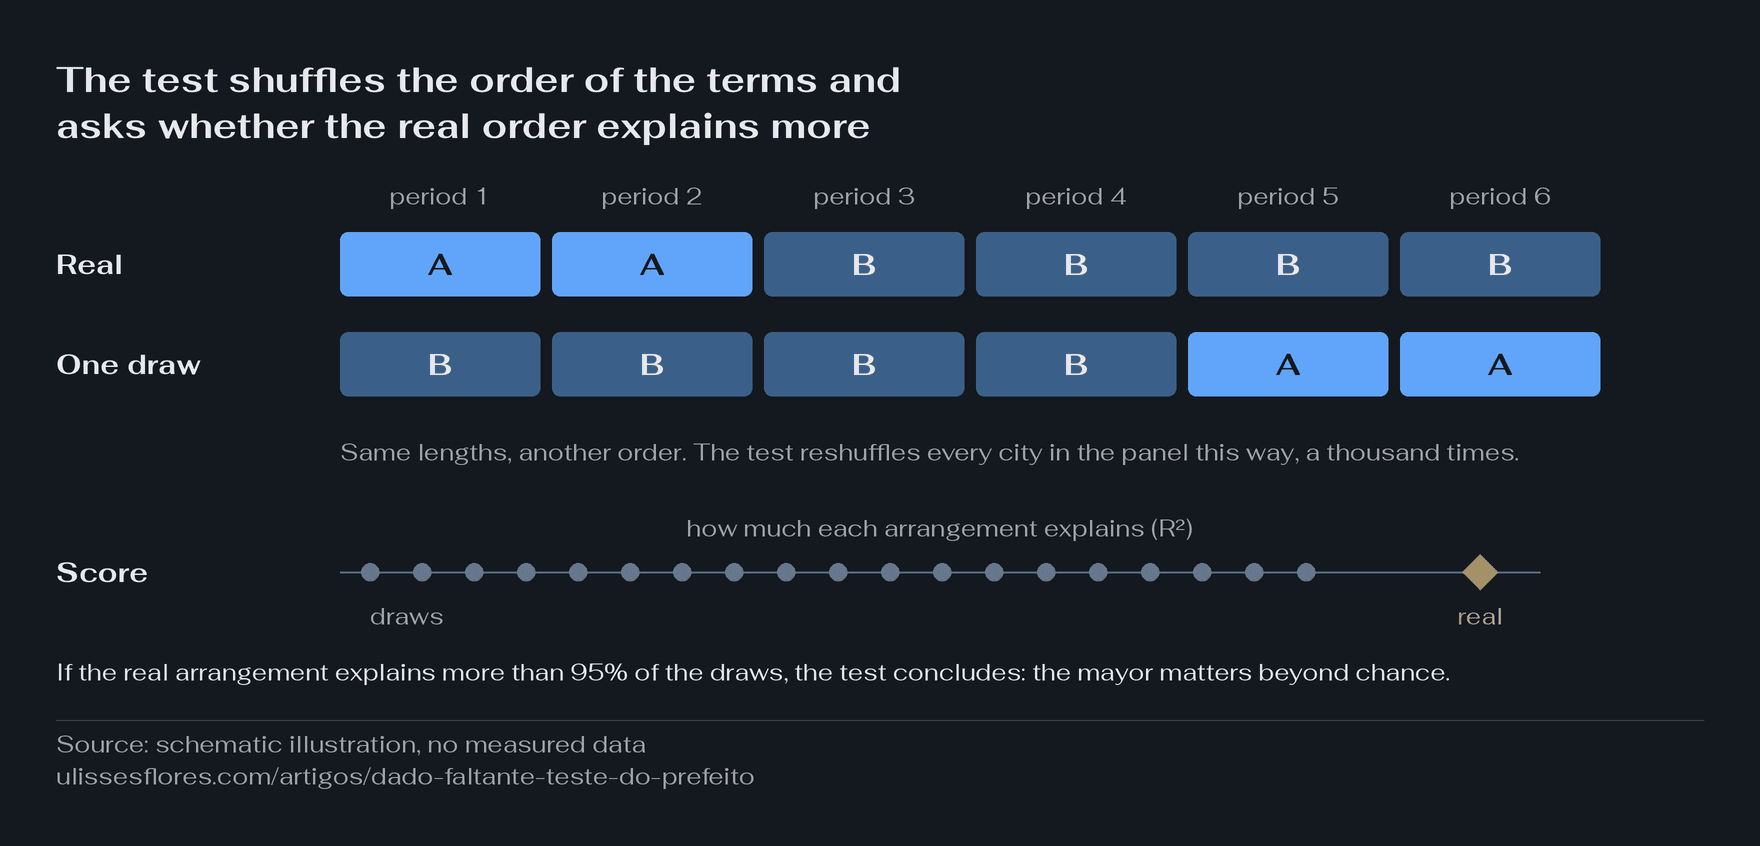
Note that the two bands have the same people and the same lengths; only the order changes. The test's name is RIFLE, for Randomization Inference for Leader Effects.
The math, without a formula: I cover the mayor's name and try to guess the index of each period. Then I uncover the name. If each person's periods resemble one another, knowing the name helps the guess. The share of the variation that the name explains, from zero to one, is the R-squared (R²). The test computes the R² of the real history, with all the cities of the panel together, and compares it with the R² of a thousand draws. In each draw, the order of each city's terms is shuffled, which is called a permutation. If the real history beats almost all the draws, the conclusion is that the leader matters beyond chance.
Every test errs now and then, and the deal is to err rarely. A smoke detector can beep by mistake on 5% of nights; if it beeps in 89% of kitchens with no fire, it is broken. This false-alarm rate, measured when the mayor does not matter, is called the size of the test. Berry and Fowler measured that size in simulations with no gap in the middle of the series, such as panels of 20 units by 20 periods, or without serial correlation. The defect that stopped my study lives precisely in the combination of the two.
With the gap at the change of mayor, only the draw crosses the gap
When the gap separates two mayors, the real term stops at its door. Only the stitched draw joins years that are far apart on the calendar.
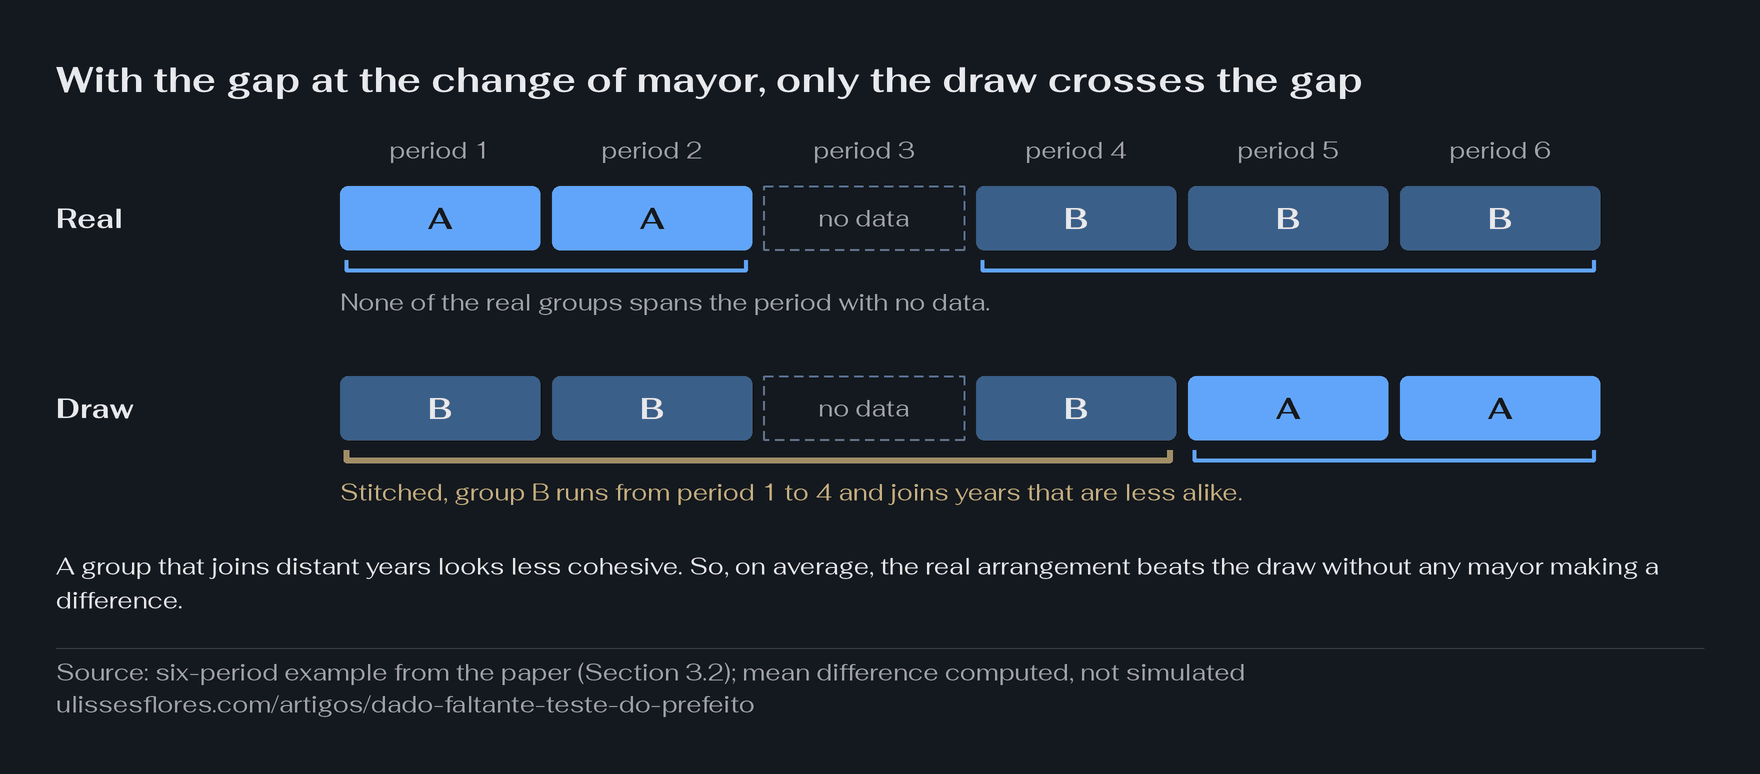
Look at the gold bracket. Mayor A governs periods 1 and 2, B governs 3 to 6, and period 3, the one with the change, is exactly the one missing. In the real history, no term crosses the gap. In the draw where B comes first, the stitching puts period 4 right next to period 2, and B's group comes to join periods 1, 2 and 4.
Periods 4 and 5 resemble each other, because they are real neighbors. Periods 2 and 4 resemble each other less, because a whole two-year period lies between them. The real arrangement joins only neighbors; the drawn one joins distant periods, and so looks less cohesive. On average, the real R² comes out larger than the draw's, even with the index generated with no person effect at all. The alarm goes off because of the glue, not the fire.
Without the kinship between neighboring years, the glue fools no one. In a simulation with a zero coefficient, a gap in 2021-22 and 1,000 municipalities, the test said "matters" in 6.4% of the datasets, consistent with 5%.
A gap somewhere else changes the side of the error
The sign depends on where the gap falls. In the middle of a long term, the test turned cautious: 0.2% in 867 municipalities.
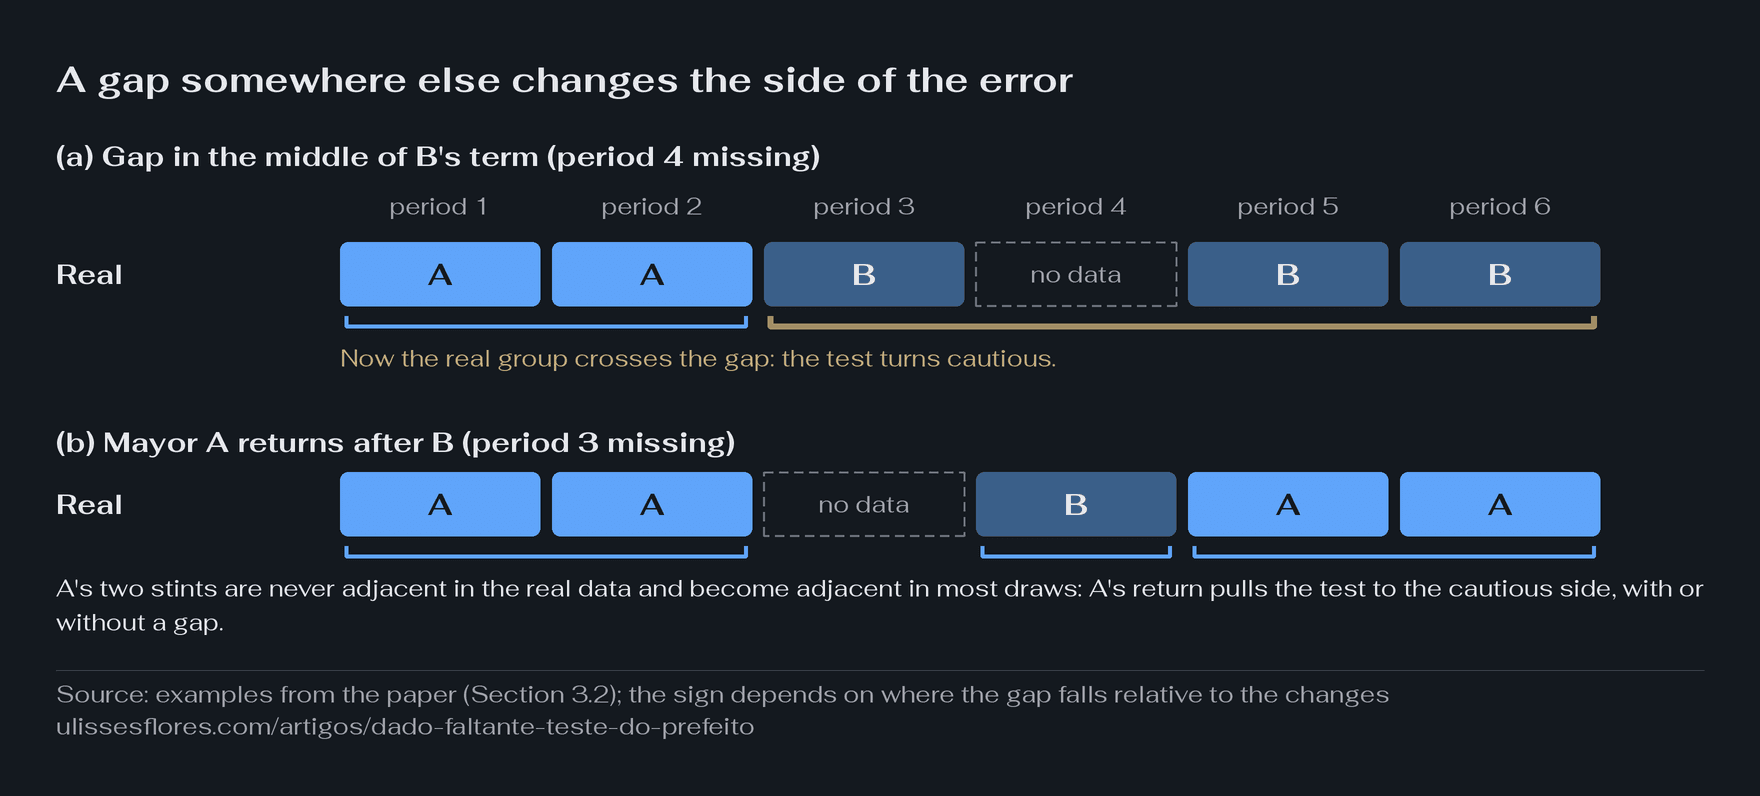
Look at scene (a): the gold bracket is now the real arrangement's. With the gap in the middle of B's term, it is the true history that joins distant years, and the draw is the one left with neighbors. The test starts to err on the cautious side: in the 867 municipalities with the gap in the middle of a long term, it said "matters" in 0.2% of the datasets, well below 5%.
In scene (b), mayor A leaves and returns after B. The package groups terms by person, and A's two stints form a single group, which in the real data never sits side by side. In the draws, they become neighbors in most orders. What pulls the test to the cautious side here is A's return, and that happens even with no gap at all; the gap at the change only reduces that push, without reversing it. These are averages from the paper's exact computation, not simulated false-alarm rates.
The paper also has an example with the gap inside a term in which the real arrangement is favored again. The rule that remains is simple to state and tedious to apply: the side of the error depends on where the gap falls relative to the changes of mayor, not only on the size of the gap.
Few cities hide the defect, and the whole panel turns it into near certainty
With 50 municipalities, the false alarm stays at 6.8%, still consistent with 5%. With 5,468, it reaches 89.4%.
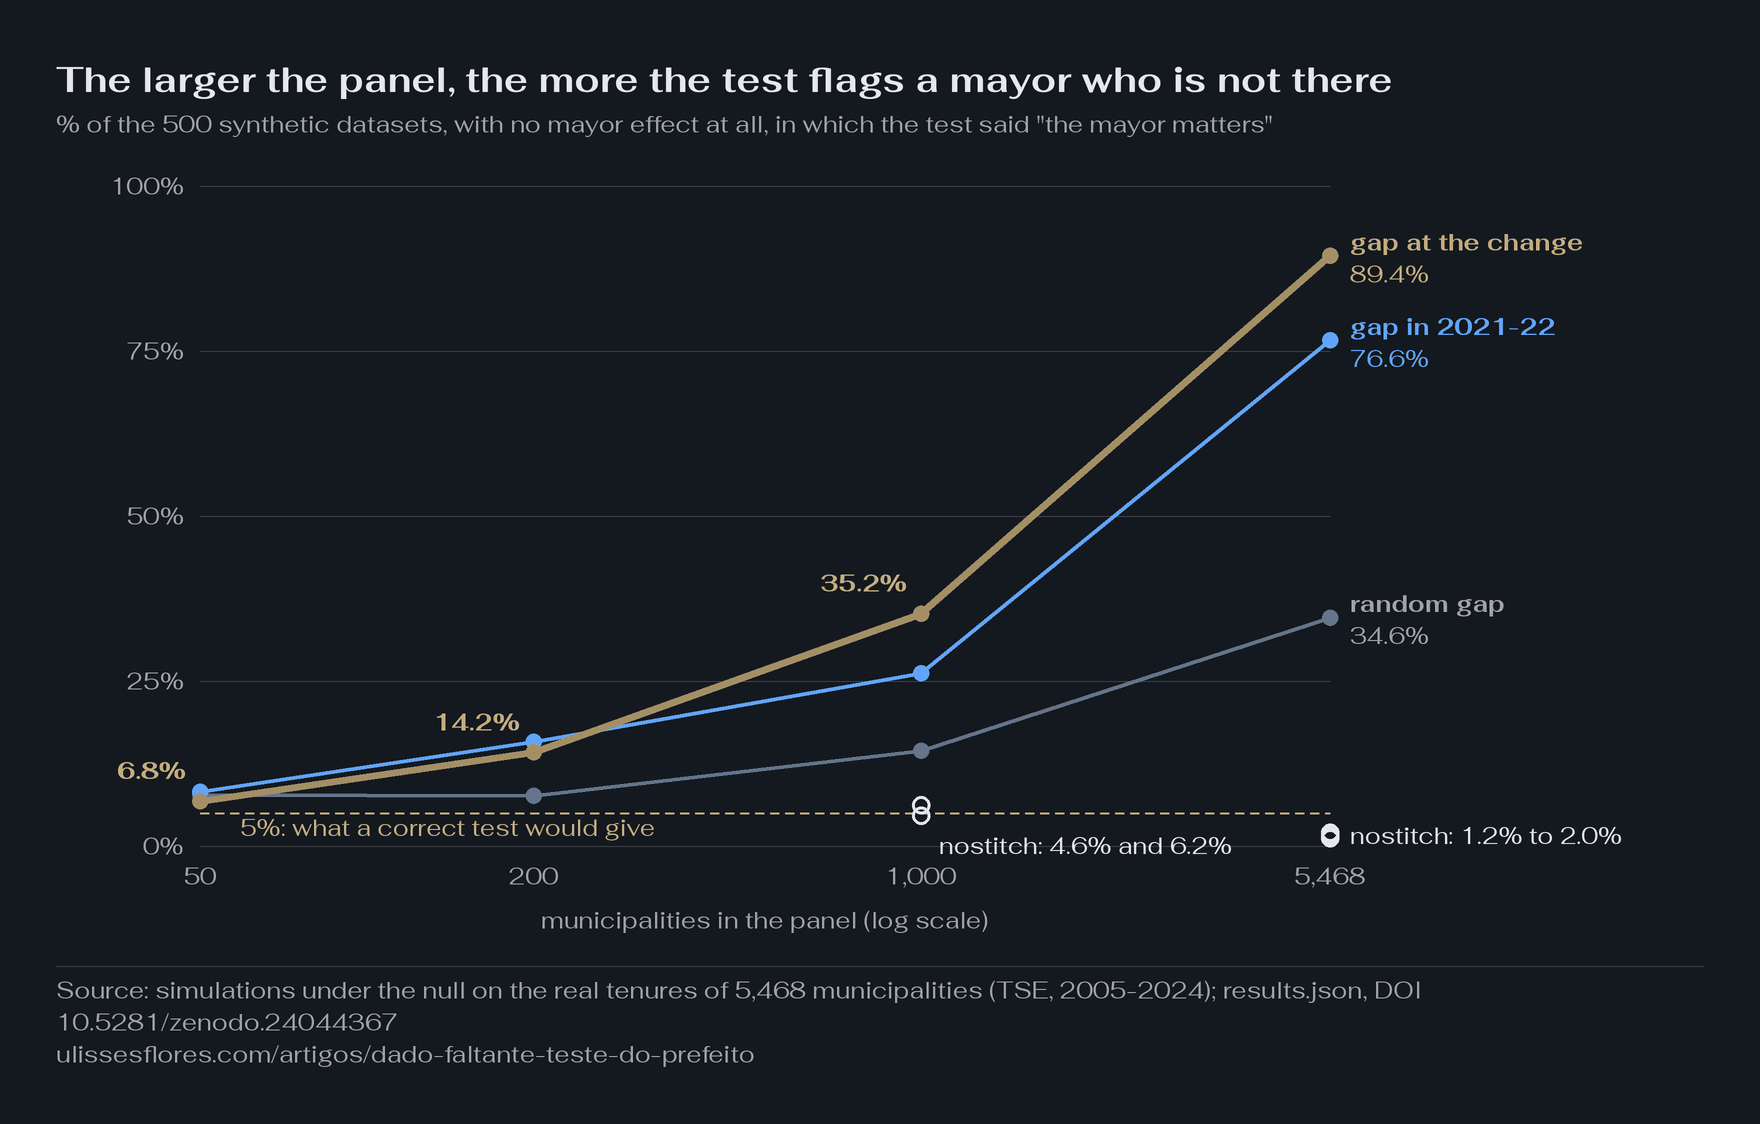
Look at the start and the end of the gold line. With 50 municipalities and the gap at the change, the error is barely distinguishable from the 5% that every test is entitled to get wrong, which is why it goes unnoticed in small panels. With all of municipal Brazil, the test says the mayor matters in almost nine out of ten datasets in which no mayor matters.
| Municipalities | Gap at the change | Gap in 2021-22 | Random gap | With nostitch |
|---|---|---|---|---|
| 50 | 6.8% | 8.2% | 7.8% | not measured |
| 200 | 14.2% | 15.8% | 7.6% | not measured |
| 1,000 | 35.2% | 26.2% | 14.4% | 4.6% (2021-22), 6.2% (random) |
| 5,468 | 89.4% | 76.6% | 34.6% | 1.2% (change), 1.6% (2021-22), 2.0% (random) |
The three stitching columns are three places for the gap. "At the change" is the pure case: the gap always separates different mayors. "2021-22" is the half-term right after the election, which in 62.3% of municipalities separates different mayors and, in the rest, has the same person on both sides; so, in large panels, it falls below the pure case. "Random" is a period in the middle of the series, chosen at random: even so, 70.1% of those gaps fall next to a change, because terms are short, and the whole panel reaches 34.6%.
With the real missing-data pattern of my study's index, the result is the same. I used only the information on which municipalities have the index in each period and made up the rest. In the 1,854 municipalities with a gap in the middle of the series, the stitching said "matters" in 34.8% of the datasets, and nostitch in 3.6%. In the 707 with a gap only at the edge, the stitching gave 3.8%. The 64.0% that stopped the study came from my study's own engine; the official package, on the same gaps, gives that 34.8%. Both are far from 5%.
With nostitch, the inflation of tens of points disappears in the measured cells: with 1,000 municipalities the test stays near 5% (4.6% and 6.2%), and in the whole panel it is even cautious. With no gap at all, the package already falls below 5% (2.2% with 1,000 municipalities and 0.2% with the 5,468), and the cause of that was not isolated. When the mayor really matters (an effect equal to 10% of the variation), the test detects it in 98.8% of the datasets with no gap and in 98.4% with nostitch, both with 1,000 municipalities. The fix, there, does not blind the test. That detection was measured only in cells in which nostitch discards no stretch; with the gap at the change, with 50 and 200 municipalities and in the whole panel, I did not measure it.
With thousands of diaries, the same gap becomes an almost certain error
One diary with one glued page fools little. Thousands, glued at the same place, fool almost always, because the test adds them all up.
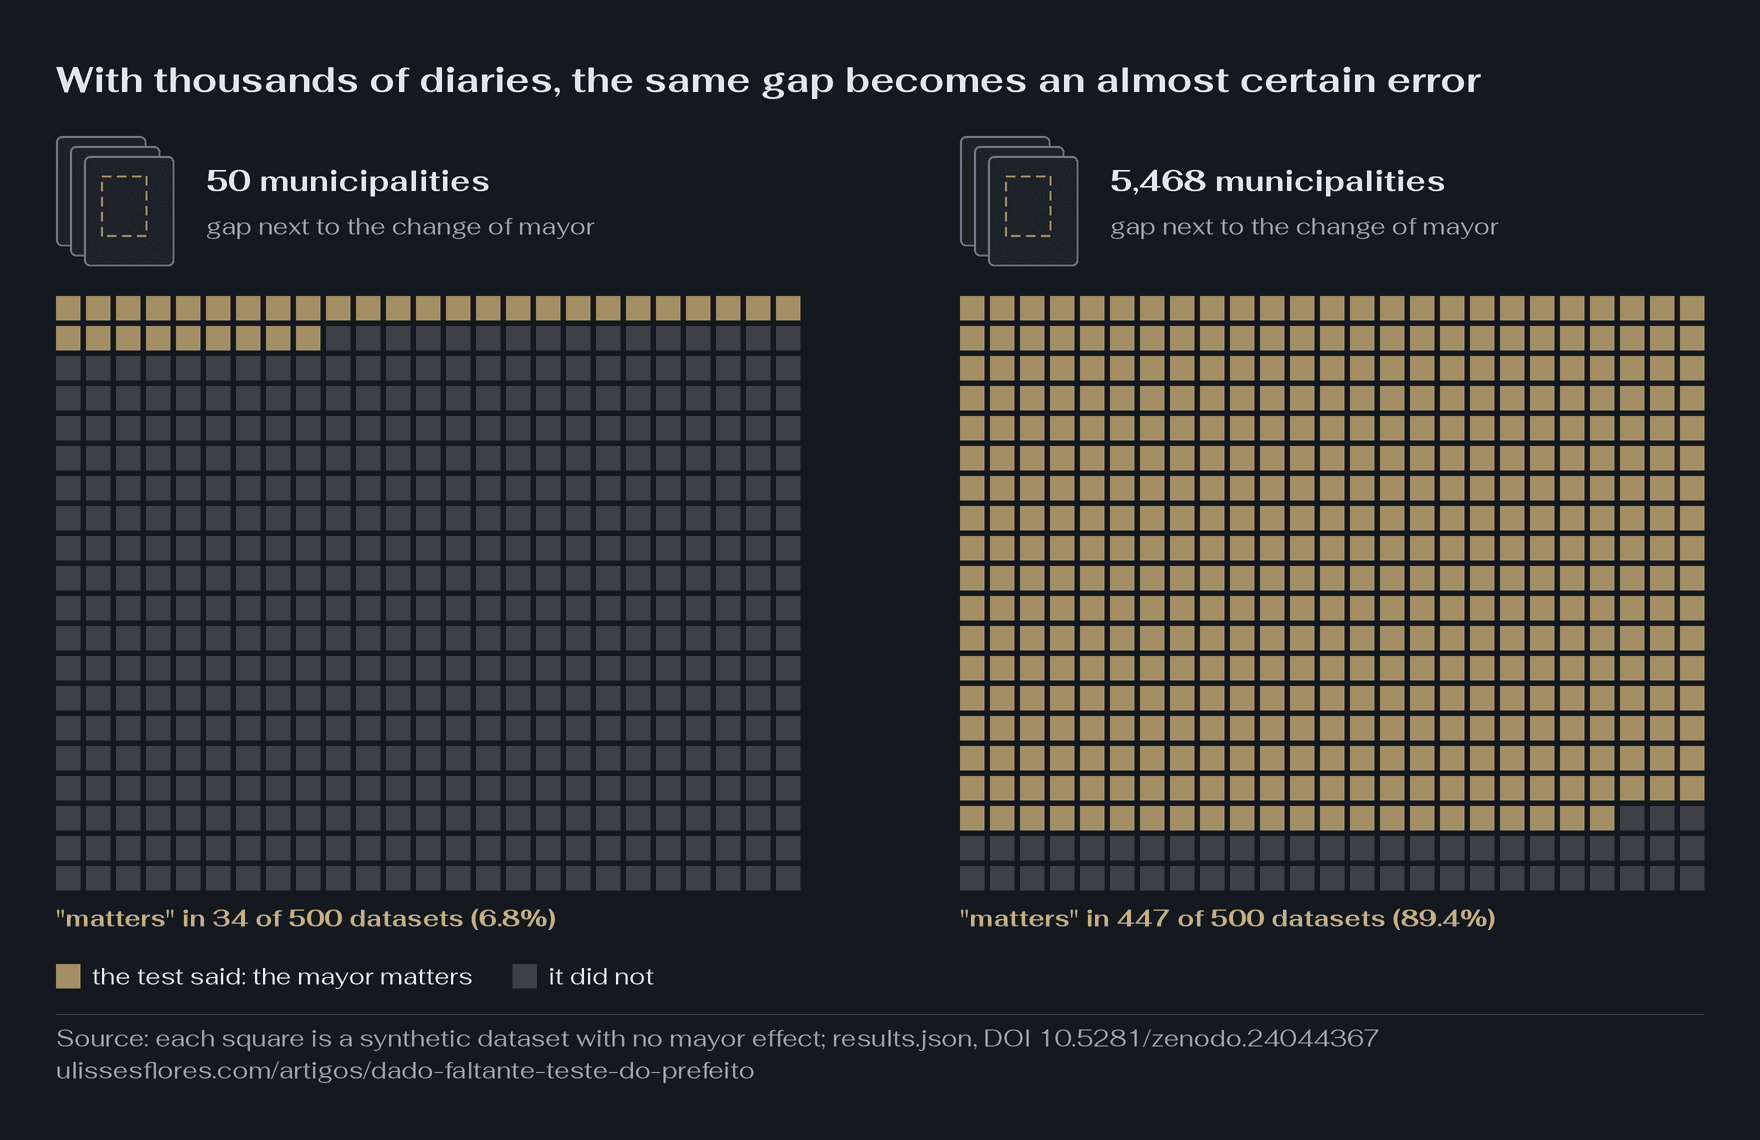
Look at the stack of diaries: it is the one from the first figure, now with the page torn out always at the same place relative to the change of mayor. Each municipality pushes the result a little to the same side. With 50, the push vanishes in the test's normal variation; with 5,468, the pushes add up and the test almost always concludes that the mayor matters. The small panels with no gap in which the size of the test was checked did not have this stack.
That is what happened in my study. I redid the test shuffling the order only within continuous stretches, a relative of nostitch, and confirmed the size at 5.2% in a round of 2,000 datasets declared in advance. Only then did I look at the real mayors, once. No evidence of a mayor effect appeared: the p-value in the main sample was 0.869, meaning most draws explained the index better than the real history. The recorded conclusion is "equivalence not demonstrated". The data show no mayor effect, and they also do not allow saying that the mayor does not matter.
Knowing whether a leader matters is a different question from knowing whether a policy worked. The second has its own methods, and what they have already measured in Brazil is in what scientific research has measured causally about Brazil's policies. And when the question is "which government was better", public data answer only part of it, as I showed in what public data answer about Brazil's best government.
What I would do with this
I would not write that a leader matters without first measuring the test's false alarm on data in which no leader matters.
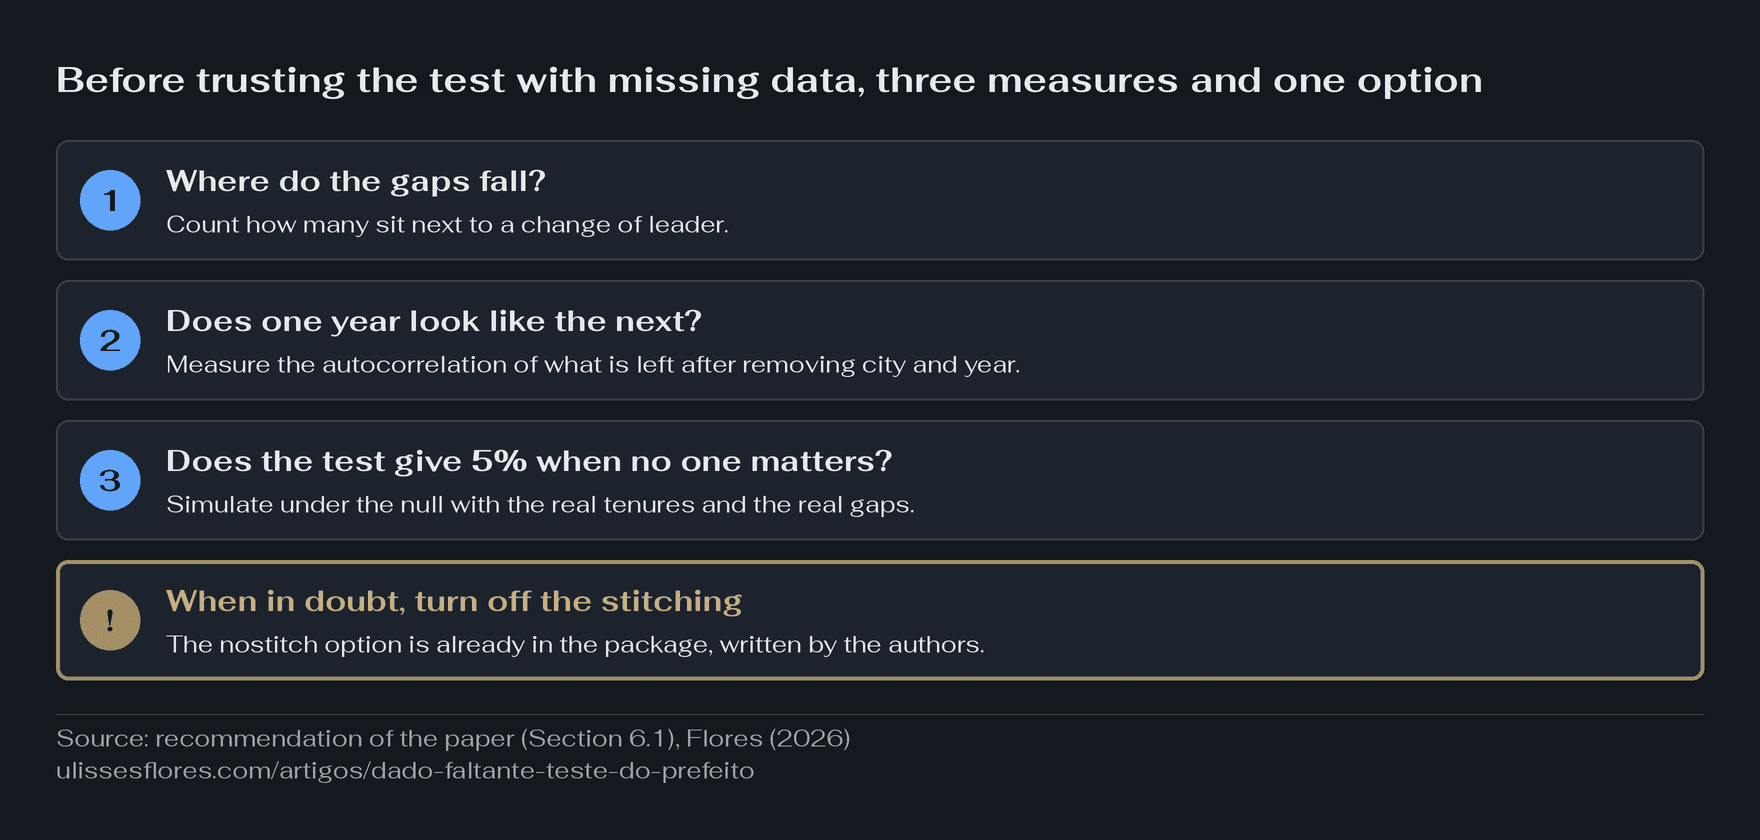
- Where do the gaps fall? Count how many sit next to a change of leader. Here, 70.1% of the random gaps fall there.
- Does one year look like the next? Measure the autocorrelation of the residual, what is left of the outcome after discounting city and year. With 1,000 municipalities and the gap in 2021-22, the stitching gave 6.4% with a zero coefficient and 26.2% with 0.217.
- Does the test give 5% when no one matters? Simulate the test on data with no leader effect, with the real terms and the real gaps. Calibrating on a small panel and publishing on a large one is calibrating a different question.
- When in doubt, turn off the stitching. The package's help already recommends
nostitch"if there is a long gap between periods or some other reason not to comprate [sic] observations across missing periods". What these simulations add is that a short gap, of a single half-term, is already enough when it falls at the change: length alone is not enough for the diagnosis, and the position of the gap relative to the changes has to enter it.
nostitch is not a universal guarantee. In the whole panel it left the test cautious, between 1.2% and 2.0%; with 1,000 municipalities it stayed near 5% (4.6% and 6.2%, the latter without ruling out a few points of inflation); in panels with another structure, it was not measured. And it bears repeating: I did not reanalyze any published result by Berry and Fowler, and the fix is theirs.
When the paper came out, in 2021, the open conversation on X and Reddit was about who matters more, the company CEO or the team's coach. In a search on November 7, 2026, I found no post about missing data. In the academic databases I consulted (OpenAlex, Semantic Scholar, Crossref, the first page of Google Scholar, plus the package's help and code), I did not find the distortion documented either. A work that extends RIFLE, by Smith and Gray (2021), I did not read in full; if it dealt with gaps, the "nobody had documented it" part falls, and the measurement made here stands.
Data and code. The code, the package's translation into Python, the simulation outputs and the full paper in four languages are in the public repository rifle-gap-bias, version 1.0.0, citable by the concept DOI 10.5281/zenodo.24044367. In the repository folder, python run_all.py redoes the figures and the table and checks every number in the paper. If your calculation differs from the table above, send it to me: I will correct it and give you credit.
Methodological note. Numbers checked on November 7, 2026 against the repository's
results.json, version 1.0.0. Real terms from Brazil's Superior Electoral Court (the Tribunal Superior Eleitoral, TSE): 5,468 municipalities, ten two-year half-terms, 2005-2024. Synthetic result: autoregressive noise with coefficient 0.217, calibrated on the real index, with no mayor effect at all in the false-alarm simulations. Each cell has 500 datasets and 1,000 draws per dataset. The 64.0% of the pilot comes from my study's engine, not from the package's translation. The package's translation into Python was tested by hand, not against Stata, which I did not have.
Sources
- Berry, C. R., & Fowler, A. (2021). Leadership or luck? Randomization inference for leader effects in politics, business, and sports. Science Advances, 7(4), eabe3404. https://doi.org/10.1126/sciadv.abe3404
- Berry, C. R., & Fowler, A. (2018). RIFLE: Stata module to perform randomization inference for leader effects. Statistical Software Components S458461. https://ideas.repec.org/c/boc/bocode/s458461.html
- Flores, C. U. (2026). Does a mayor improve a city beyond chance? Missing data at a change of mayor makes the test say yes: Replication package (version 1.0.0). Zenodo. https://doi.org/10.5281/zenodo.24044367. Repository: https://github.com/ulissesflores/rifle-gap-bias
- Smith, D. S., & Gray, T. R. (2021). Looking for leadership in historical context: An extension of the RIFLE method of randomization inference. Journal of Historical Political Economy, 1(2), 215-234. https://doi.org/10.1561/115.00000010 (not read in full)
- Tribunal Superior Eleitoral (Superior Electoral Court). Open data portal. https://dadosabertos.tse.jus.br
Checked on November 7, 2026 against the results.json and the paper of the rifle-gap-bias repository, version 1.0.0. I did not run Stata: the package's translation into Python was tested by hand. I did not reanalyze any published result by Berry and Fowler. I did not read Smith and Gray (2021) in full. The search on X and Reddit was done by another agent, and I did not open each post. The simulation results are synthetic: the structure of the terms is real, the index was made up on purpose, with no mayor effect.