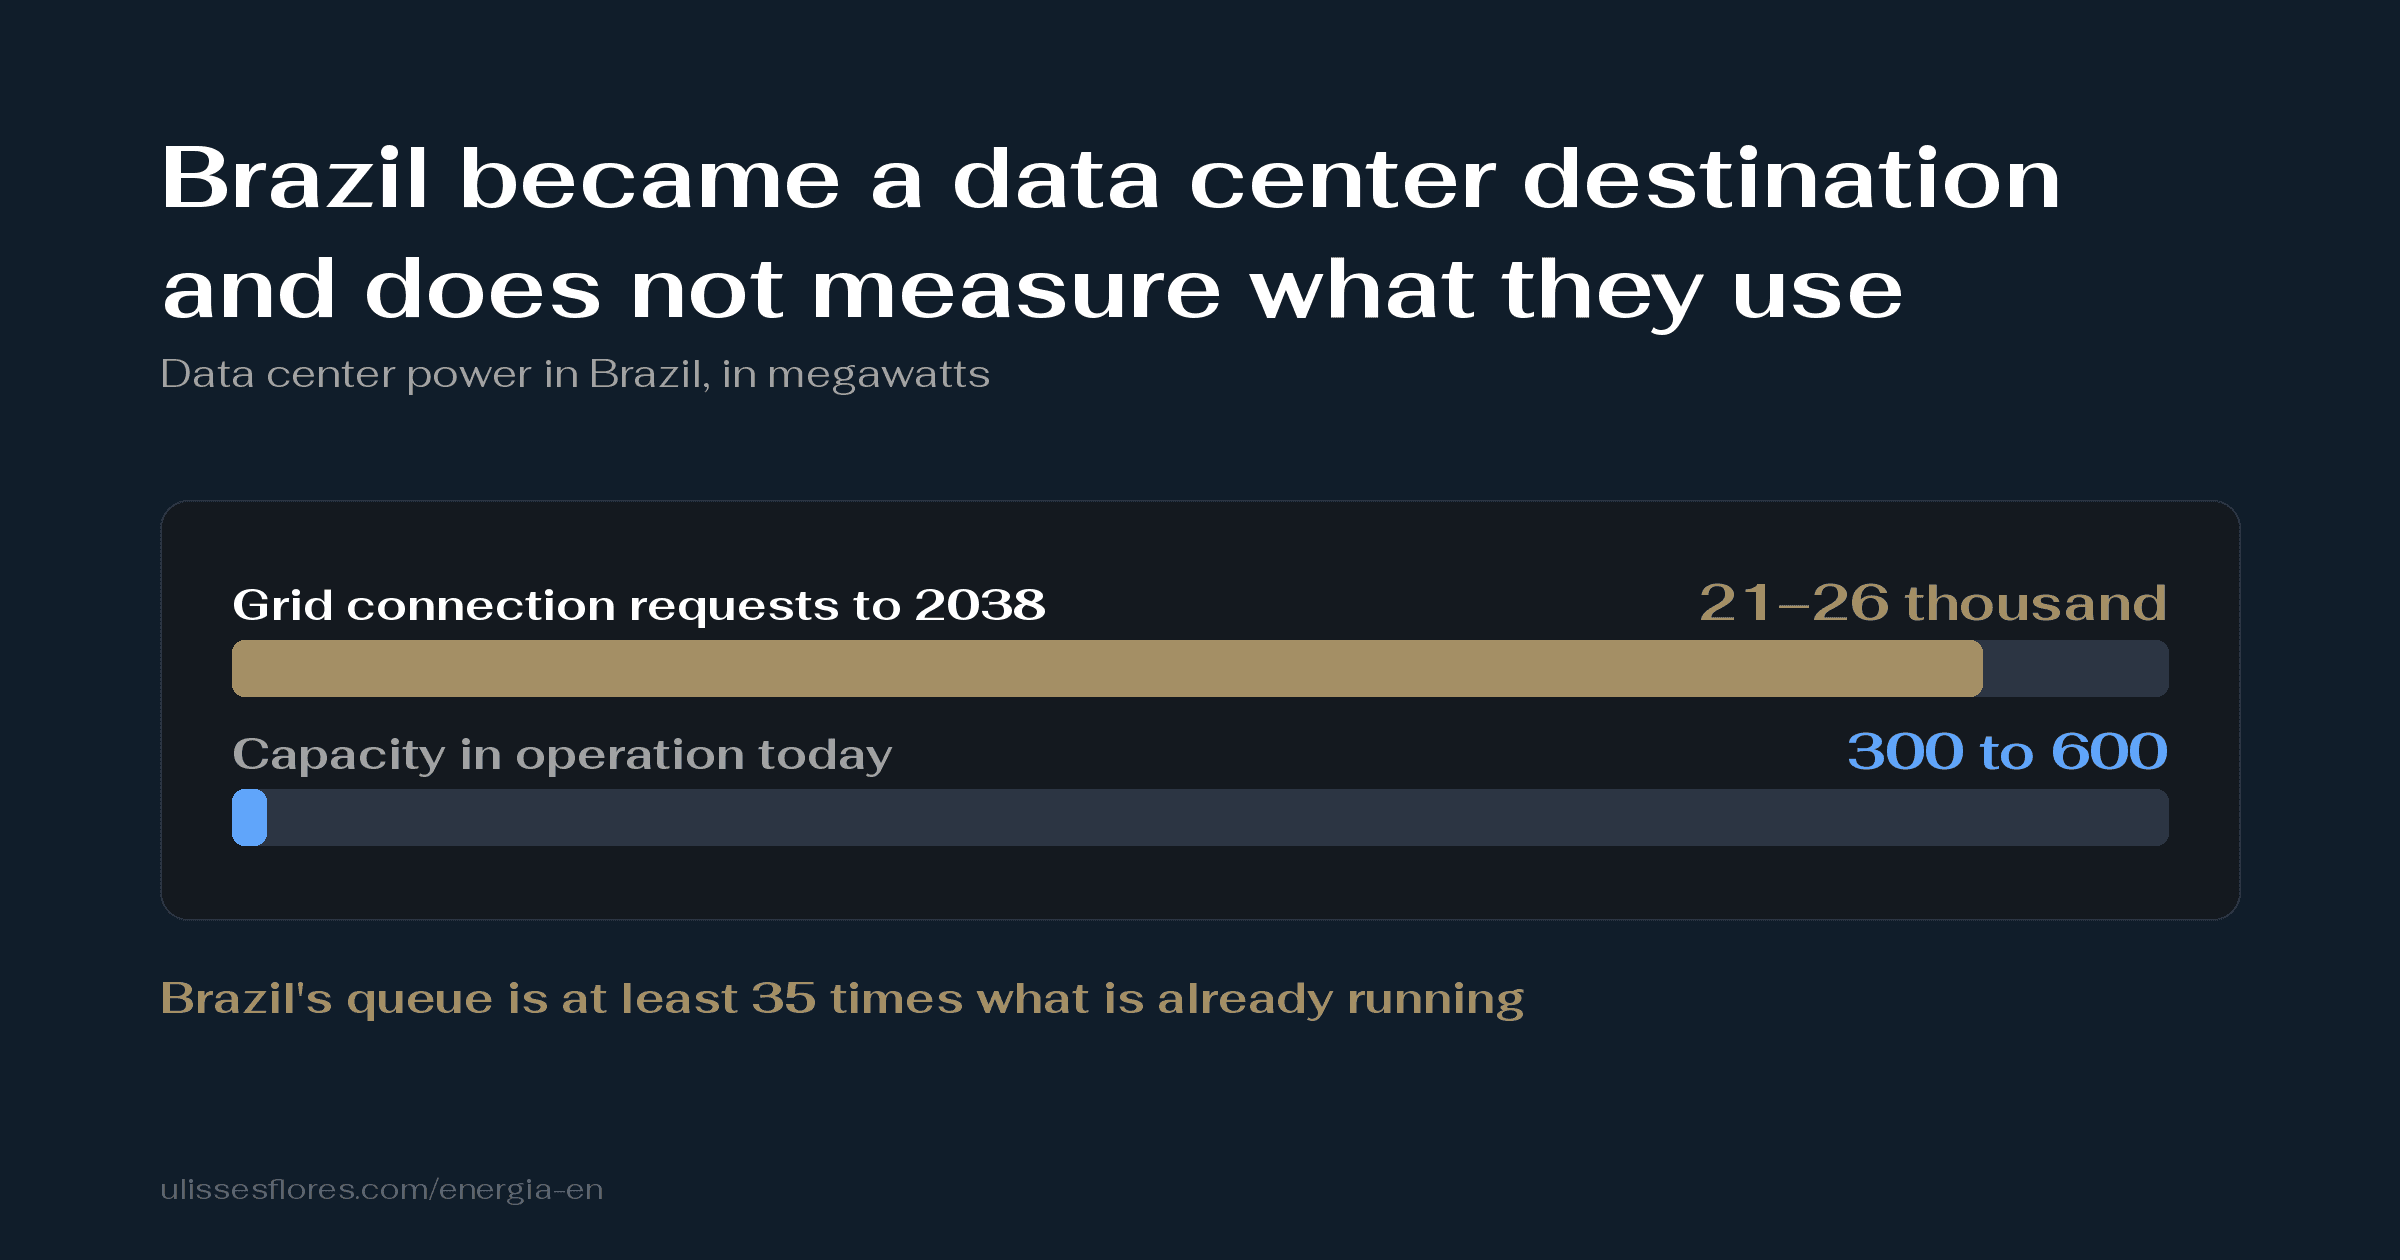
Brazil has between 21 and 26 gigawatts of data centers queuing for a grid connection and no official figure for what that queue will consume. On the eve of the day I started this investigation, on 1 September 2026, the Senate approved the tax regime that accelerates the queue.
I went to check the numbers circulating about the energy of artificial intelligence, one by one, against each one's primary source. Six of the seven that decide this conversation had the wrong data sheet attached — and the seventh, the only one that would decide anything here, does not exist.
Methodological note. Every number below was read by me in the original document — report, paper, submission table or official statement —, not in whoever repeated it. Where I calculated something myself (a ratio, a sum, a variation), the calculation is in the public repository linked at the end, with a test locking the published value. The community searches covered X/Twitter and Hacker News: Reddit was left out, because the public interface returned error 403 on every thread and the alternative route returned 429. There was also no publication by Sasha Luccioni, Alex de Vries or Jonathan Koomey in the six-month window I swept — the three names that normally anchor this debate were silent in the period.
| # | The number in circulation | What the primary source says |
|---|---|---|
| 1 | 0.34 Wh per prompt (OpenAI) | ❌ a loose sentence in a text by the company's president, with no methodology, no model and no link |
| 2 | 0.24 Wh per prompt (Google) | ⚠️ correct, but it excludes model training — the paper itself says it left that for later |
| 3 | "33 times more efficient in 12 months" | ⚠️ 23 times of that is switching models, not engineering efficiency |
| 4 | "25 times more energy efficiency" (Nvidia GB200) | ❌ a projected figure, and with no power measurement submitted at all in the last three rounds of MLPerf Inference |
| 5 | "FGV study: 26.7% drops to 17.7% with REDATA" | ❌ the study is Brasscom's, and 17.7% is still more expensive than the United States |
| 6 | "TikTok in Pecém: 4.75 GW, 120 times São Paulo" | ❌ the 4.75 GW belong to another company, in Rio Grande do Sul; Pecém is 300 MW |
| 7 | How much Brazil's data centers will draw from the grid | ✅ there is no published figure — and the body that ought to publish it says so in as many words |
The wrong question is how much one prompt costs
Everyone who discusses the energy of artificial intelligence discusses the same unit: watt-hours per prompt. It is a small figure, likeable and easy to repeat. And it is also a figure that changes size according to where whoever measures decides the bill begins and where it ends.
Think of a price tag that does not count the shipping, does not count the tax and does not count the factory. It is not lying. It is answering a smaller question than the one you asked.
Notice that the chain has five links and the figures in circulation cover the first two. The third link — training the model — is left out in writing: Google's paper on Gemini's consumption says, in the letter, "we leave the measurement of AI model training to future work". The fifth link, the grid, appears in none of the corporate reports I read.
The most repeated number in the world about the energy of AI has no data sheet. OpenAI's 0.34 watt-hours came out of a sentence in a personal essay by Sam Altman, in June 2025, without saying which model, without saying what went into the count and without a link to a measurement. Epoch AI's 0.3 watt-hours, which circulates as if it confirmed Altman's, is from February 2025 — four months earlier. The two never spoke to each other; the coincidence in order of magnitude is coincidence.
Google's does have a data sheet, and that is why the hole is visible: 0.24 watt-hours per prompt with cooling, idle servers and electrical losses included, and training left out. Between the wide and the narrow measurement boundary there is a factor of 2.4 times. Andy Masley, who publicly argues that per-prompt consumption is small, calculated that amortising training almost doubles the number — that is the argument coming from the defence lawyer, not from the prosecutor.
The same holds for the efficiency jump the press called "33 times in twelve months". Google's paper says, also in the letter: "a 33x reduction in per-prompt energy consumption (…) including a 23x reduction from model improvements, and a 1.4x reduction from improved machine utilization". The factors multiply: 23 × 1.4 gives the 33. Almost the whole gain is switching models, not getting better at the same model — and switching models is a product decision the company can undo tomorrow.
This is a lesson that has appeared here before, on another subject: the number changes when the ruler changes, not when the world changes. It is what happened when the same AI model changed score on switching evaluation harness.
Nvidia's 25x is the only number on the list with no audited counterpart
The GB200 NVL72 page announces "Energy Efficiency 25X vs. H100" — 25 times the energy efficiency of the H100. The page itself marks the datum as projected performance subject to change. So far this is normal manufacturer advertising.
What I did not expect to find is what came next. MLPerf Inference: Datacenter is the round of tests in which the industry submits audited results; it has a specific category in which power is measured at the wall, with the real consumption of the whole system during the test. I went to count how many power measurements Nvidia submitted for the Blackwell generation — the generation of the 25x.
I downloaded the submission record of the last three rounds (v5.0, v5.1 and v6.0) straight from MLCommons' public repository and counted line by line.
| Round | Results submitted by Nvidia | With measured power |
|---|---|---|
| v5.0 | 75 | 0 |
| v5.1 | 34 | 0 |
| v6.0 | 61 | 0 |
| Total | 170 | 0 |
One hundred and seventy results submitted by Nvidia in the last three rounds, none with a power
measurement. And it is not that the category is impossible to meet: in the previous generation
Nvidia itself met it. The systems with the MaxQ suffix are its submissions with measured power,
and they exist for the H100 in round v4.0 and for the H200 in v4.1 — with the measurement
directories in place, exactly as the rule demands.
Notice what the timeline does not say: it does not say that Nvidia refuses to measure. I do not know anyone's intention, and nobody needs that information to understand the problem. What the record shows is what it contains — and it contains 170 results without power. Measuring Blackwell is possible, and someone did it: Lenovo submitted 12 results with measured power on servers with B200 boards, in round v5.1. It was not the manufacturer that publishes the 25 times.
Two honest caveats, because they change the size of the claim. The first: this holds for MLPerf Inference: Datacenter, plus the few lines from Nvidia itself in the edge categories, in rounds v5.0, v5.1 and v6.0. I did not sweep Green500, SPECpower or the other MLPerf suites, and therefore I claim nothing about them. The second: this 25x cannot be compared with the "2.6 times" that circulates as if it were the audit of it. They are different quantities — the 25x is energy efficiency, the 2.6x is raw performance per board, and it comes from a blog by Nvidia itself. Pairing the two would be me committing exactly the defect this article came to catalogue.
The average bill hides who pays the bill
Before leaving watt-hours per prompt, it is worth looking at what the average hides — because it is the same mechanism that will hide Brazil three sections from here.
A preprint from June 2026, by researchers from Michigan, Cambridge and Aberdeen, measured the energy consumption of open language models in 122 languages, with the same set of questions translated into all of them. The distance between the cheapest and the most expensive is 179 times.
I was going to write this passage another way. The version I had in my head was "the unit the world discusses was measured in English, and you, who read in Portuguese, pay more". I went to check the table and the second half is false: Portuguese is the second cheapest language of the 122, behind English alone, at 1.47 times its energy. Publishing the original version would have been manufacturing an indignation against my own source.
What the table shows is worse, and it is not about us. The divide exists and it is brutal, only it falls on those who speak Pashto, Tibetan and Shan — and those same languages receive the wrong answer far more often. Shan spends 175 times the energy of English to get 10.6% of answers right, against 94.6% for English. The average bill disappears with whoever pays more and receives less.
Three caveats that do not fit in a footnote. It is a preprint, without peer review. The models measured are open and ran on an academic cluster board, with a hardware counter, not with a wall meter: the absolute joules are not comparable with the "0.3 watt-hours" of production, and only the ratios between languages travel. And part of the difference is not the language being longer — it is the model locking into repetition when the language is poorly covered by training, which is an engineering defect, not an intrinsic cost of the language. The paper itself gives two values for the same English-Pashto pair: 179 times in the main table and 187.8 in Table 5, which is the one feeding the figure above. I use the 179 the authors sign off on and record the difference here.
The right question is how many megawatts enter the grid, which grid, in which year
Watt-hours per prompt decides nothing. No utility plans a substation with that number, no planning body sizes a transmission line with it. What decides is how much power enters the grid, which grid, and in which year.
In the United States that number is published. The Lawrence Berkeley National Laboratory projects that the country's data centers will consume 649 TWh in 2030, the equivalent of 11.8% of all American electricity consumption, within an uncertainty range of 521 to 843 TWh. But the number almost nobody repeated is another one, and it is in the same report.
Of every three units of American electricity growth to 2030, one is a data center. It is a far harder sentence than "11.8% of consumption", and it was on the same page. The report also says something that runs against common sense: the scenario that pushes the projection highest is not training bigger models, it is an idle inference server, sitting there waiting for a prompt. On its own, that scenario takes the projection to 782 TWh.
A note of verification about the source that brought me here: a well-made German survey, which gets the LBNL right, gets the EPRI right and gets most of the International Energy Agency right. It errs on one point that any reader checks with a division — it repeats "about 1.5% of global consumption" for 2024 and for 2025, saying in the same text that consumption rose 17% between the two years. For the share to stand still, the world's electricity consumption would have had to grow 17% in a year. It did not. The International Energy Agency itself gives the right value: 1.7% in 2025, heading for about 3% in 2030.
Whoever measures publishes down to the address — and Latin America has no address
Microsoft publishes a document attached to its sustainability report in which it lists the electricity consumption of its data centers location by location. There are 29 addresses, from Dublin to Boydton, Virginia, adding up to 15,931,489 MWh — 43% of all the company's electricity.
Of those 29 locations, a single one is in Latin America: Querétaro, in Mexico, with 6,362 MWh. Except that another table in the same document gives the consumption of the entire region: 661,556 MWh in fiscal year 2025.
The subtraction is one line: 661,556 minus 6,362 gives 655,194 MWh — 99.04% of Microsoft's Latin American consumption with no published location. And the clincher is in the methodology table of the same document, where the company names Brazil: it uses the average emission factor of the Brazilian Ministry of Science and Technology to calculate the emissions of the electricity it consumes here. It knows how much it consumes in Brazil. It calculates the emissions of that. And it does not publish the number.
The mandatory caveat: that table covers only owned data centers, with operational control, and excludes locations that "collectively represent less than 1%" of the total. Brazil's absence is compatible with leased third-party capacity or with that cut-off threshold, and the document does not say which of the two is the case. I do not know either, and I am not going to invent the cause: what is on the record is the absence.
The one who does not measure is Brazil, and the body that should measure says so in writing
Brazil's Energy Research Company ran the country's first collection of data center consumption data in October and November 2025, covering between 65% and 82% of the market, and recorded in a December presentation that "the data from this collection are not yet reflected" in the expansion plan. It is not that the number is bad. It is that it does not exist yet.
Meanwhile, the queue grows.
Between 21 and 26 gigawatts in connection requests up to 2038, against something between 300 and 600 megawatts running today. The smaller bar is so small on the scale of the larger one that it almost disappears — and that is the real proportion. Not every connection request becomes a data center: the queue is intention, not construction. But that is exactly why it would need to be measured and published, the way the Lawrence Berkeley publishes the American one. In the United States this same pattern — a queue far larger than construction — is already mature enough for counties in Virginia to be discussing a moratorium.
And the regime pulling that queue is not law yet. The bill creating REDATA was approved by the Chamber of Deputies in February 2026 and by the Senate on 1 September 2026 — the eve of this investigation. It is awaiting presidential sanction. Anyone writing "Brazil approved the regime" without that distinction is bringing forward a step that was not taken.
The Brazilian numbers in circulation already have the wrong owner
Twice, while tracing Brazilian numbers on this subject, I reached the source and found something else. These are not typing errors: they are numbers that changed owner along the way.
The first case is the FGV study that is not FGV's. It circulates that "an FGV study shows that the cost of a data center in Brazil is 26.7% higher than in the United States, and drops to 17.7% with REDATA". I went to read the report. On page 59 it is written that a preliminary study by Brasscom — the technology industry association, not the FGV — is the one estimating those values; that the FGV Projetos report was commissioned by data center operators; and, above all, that the 17.7% is still more expensive than the American benchmark. Parity, says the same sentence, only arrives with REDATA plus a state tax adjustment. The post that circulated cut out exactly the half that changes the conclusion.
The second case travelled 2,900 kilometres. It circulates that TikTok's data center in Pecém, in Ceará, will reach 4.75 gigawatts, more than 120 times São Paulo's 39 megawatts. The 4.75 gigawatts exist, and they are real — except that they belong to Scala Data Centers, on a campus called AI City, in Eldorado do Sul, in Rio Grande do Sul. The Pecém project, according to the official position of the Government of Ceará in August 2026, is 300 megawatts gross, 200 of them for information technology, with operation expected for the last quarter of 2027.
It is the same chain as the first figure, with different content: each link is defensible on its own, and the result at the end is false. With the right number, the ratio against São Paulo is not 120 times: it is 7.7. It is still a great deal. It just is not what was said.
This is a close relative of a lesson that has appeared here before: the statistic in circulation can be thousands of times smaller than the claim — and the mechanism is always the same, a correct number that loses its origin label along the way.
The real asset is carbon, and the real constraint is water
The sales argument for Brazil as a data center destination is the clean electricity mix, and it is true. Calculated with each country's official figures, the same megawatt-hour consumed here emits a fraction of what it emits there.
46.1 grams of CO2 per kWh in Brazil, against 348 in the United States: seven and a half times less carbon for the same consumption. It is a real asset, and it is rare for a country to have such a clean argument.
Except that carbon is not the constraint here. Water is. The country's two largest data center hubs, Ceará and São Paulo, were in November 2025 among the eight states with drought across 100% of their territory. In the most advanced project, in Caucaia, in Ceará, the state permit released a withdrawal of 144,000 litres of water a day, against 19,700 litres declared in the licensing — 7.3 times more. And the Federal Public Prosecutor's Office recommended, in May 2026, suspending the start of operations until indigenous consultation and hydrogeological monitoring are in order.
When the real constraint is other than the one being discussed, the bottleneck does not move — and that is a lesson that already holds for any system with a single real bottleneck.
The comparison I did not make, and why
You may have noticed that this article did not translate any consumption into "equivalent to so many homes". It is the favourite comparison of whoever writes about this, mine included, and the very report that produced Pecém's official figure uses the device in its headline: the consumption of Ceará's data centers "equivalent to 7 million homes".
I left it out because the state environmental body, Semace, contested the device in that same report: the comparison "must be analysed with caution", because a data center runs 24 hours a day with concentrated load, a home fluctuates through the day, and the domestic metric does not count the indirect consumption of energy by public services and spaces. The objection is a good one and holds against me as much as against anyone else. The comparison with homes gives scale, it does not give equivalence — and an article that spent seven sections demanding data sheets for other people's numbers had no way to use that one.
What would need to be published
There is no need to invent a new institution or wait for any technology. What is missing is already published elsewhere, in the same format:
- Contracted load per project, with location and year of entry. It is what the Lawrence Berkeley publishes in the United States and Bitkom publishes in Germany. Brazil's Energy Research Company has already collected the datum; what is missing is publishing it separately in the expansion plan.
- The queue separated from the construction. A connection request is not a data center. Publishing the two numbers side by side — requested and energised — solves half the confusion this article catalogued.
- The water permit next to the electrical load. In the country's most advanced project the two numbers already diverge by a factor of 7.3, and they live in databases that do not talk to each other.
- Measured power, not projected, from whoever sells efficiency. The category exists, it is audited, and the manufacturer advertising 25 times already met it in the previous generation.
Until that exists, the reader's only defence is the most tedious one: asking whose the number is before asking whether it is big. Almost every number in this investigation was true somewhere — it just was not true in the place where it was being used. The most repeated of them all was not true anywhere, because it never had anywhere to be checked.
The calculations I made for this article — the count of MLPerf Inference submissions, the series of PJM auctions, the variation in the American residential price, the sum of Microsoft's locations and the table of 122 languages — are in the public repository linked below, with a test locking every number that appeared here. Run it and check. If it comes out different, send it to me: I update the text and give credit.
Sources
- LBNL, 2025 United States Data Center Energy Usage Report
- IEA, Energy and AI Observatory — Key Questions on Energy and AI (2026)
- Google, 2026 Environmental Report
- Google, Measuring the environmental impact of AI inference (arXiv:2508.15734)
- Microsoft, Environmental Data Fact Sheet 2026
- MLCommons, MLPerf Inference: Datacenter
- Deng et al., The Language-Energy Divide (arXiv:2606.21869v1, preprint)
- EPE, data center data collection in distribution (Dec/2025)
- FGV Projetos, Custo Brasil for data centers
- Government of Ceará, position on the Pecém data center — Diário do Nordeste, 31/08/2026
- U.S. Department of Commerce, Brazil: Energy Demands and Data Center Growth
- Gradually.ai, KI-Energieverbrauch: Statistiken 2026 — the German survey checked in this article
- Andy Masley, on amortising training in per-prompt consumption
- Companion repository with this article's own calculations